Social media has transformed how we communicate, connect, and consume information in the modern digital age.
What began as a novel way to interact online has exploded into an ecosystem of platforms, each with its own unique features and user demographics.
As these networks continue to evolve and expand their reach, understanding the latest trends and statistics surrounding social media usage has become crucial for businesses, marketers, and individuals alike.
From Facebook‘s ubiquitous presence to the meteoric rise of TikTok, this article delves into the most up-to-date social media statistics, shedding light on user behavior, platform growth, and the ever changing online interactions.
Key User Stats
- As of 2024, there are approximately 5.16 billion active social media users worldwide, which is around 59.3% of the global population.
- Facebook remains the largest social media platform, with over 3.15 billion monthly active users.
- YouTube is the second-largest social media platform, with over 2.5 billion active users.
- Instagram has over 2 billion active users, making it the fourth largest social media platform.
- TikTok has surpassed 1 billion active users, becoming one of the fastest-growing social media platforms.
Other key Stats
- Globally, people spend an average of 2 hours and 23 minutes per day on social media platforms.
- Mobile devices account for 98% of social media usage time, with desktop usage accounting for only 2%.
- The most popular social media activities include watching videos (82%), reading news (76%), and interacting with friends and family (72%).
- The gender split for social media users is relatively even, with 48.4% male and 51.6% female users globally.
- The majority of social media users (59%) are between the ages of 18 and 34.
- In the United States, 72% of adults use at least one social media platform.
- Social media penetration rates are highest in Northern Europe (82%), followed by Western Europe (80%), and Southern Europe (75%). To fix below this
- Emerging markets like Central and Southern Asia have lower social media penetration rates, at 41% and 45%, respectively.
- Influencer marketing on social media is a rapidly growing industry, projected to reach $16.4 billion in 2022.
- Social media advertising revenue is expected to surpass $258 billion in 2022, with Facebook and Instagram accounting for the largest share.
- Social commerce (e-commerce via social media platforms) is gaining popularity, with an estimated $492 billion in sales globally in 2022.
How Many People Use Social Media?
Social media has exploded in popularity, with a staggering 5.16 billion users worldwide.
Usage is highest in North America and Europe where over 80% are active users.
However, emerging economies in Asia and Africa are rapidly catching up driven by increasing access to affordable smartphones and mobile data.
Social Media Users: 2017 to 2027
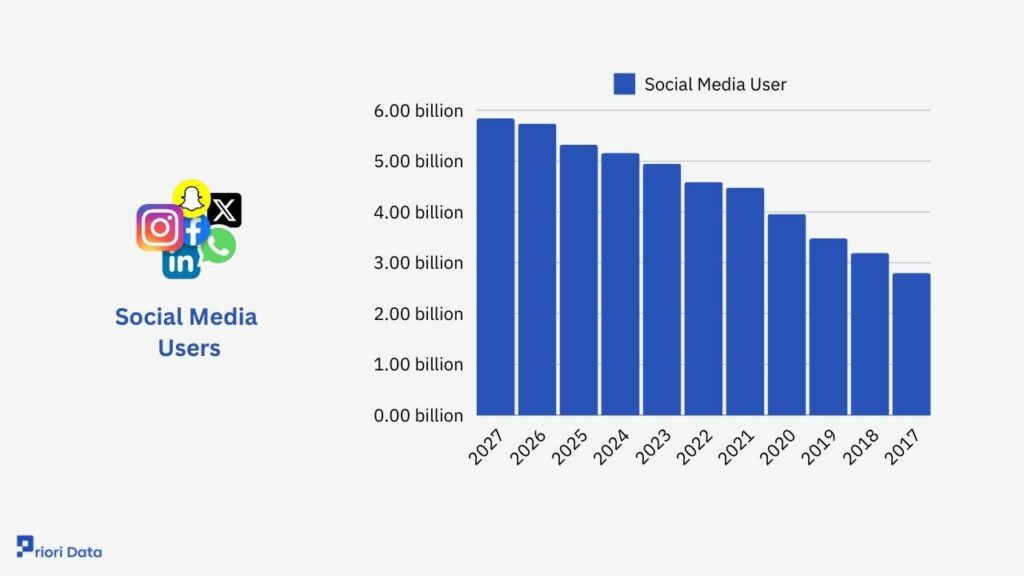
The table shows the growth of social media users globally from 2017, starting with 2.80 billion users, to a projected increase to 5.84 billion by 2027.
It shows a consistent and significant rise in social media adoption over the years. From 2017 to 2020, the numbers rose from 2.80 billion to 3.96 billion, marking a noticeable increase likely spurred by factors such as the COVID-19 pandemic.
The trend continues with an increase from 4.48 billion in 2021 to 4.95 billion in 2023, and further projections indicate a steady climb to over 5 billion users by 2024, reaching approximately 5.84 billion by 2027.
| Year | Social Media User |
|---|---|
| 2027(estimated) | 5.84 billion |
| 2026(estimated) | 5.74 billion |
| 2025(estimated) | 5.32 billion |
| 2024 | 5.16 billion |
| 2023 | 4.95 billion |
| 2022 | 4.59 billion |
| 2021 | 4.48 billion |
| 2020 | 3.96 billion |
| 2019 | 3.48 billion |
| 2018 | 3.19 billion |
| 2017 | 2.80 billion |
Source: Backlingo
Most Popular Social Media Platforms Worldwide
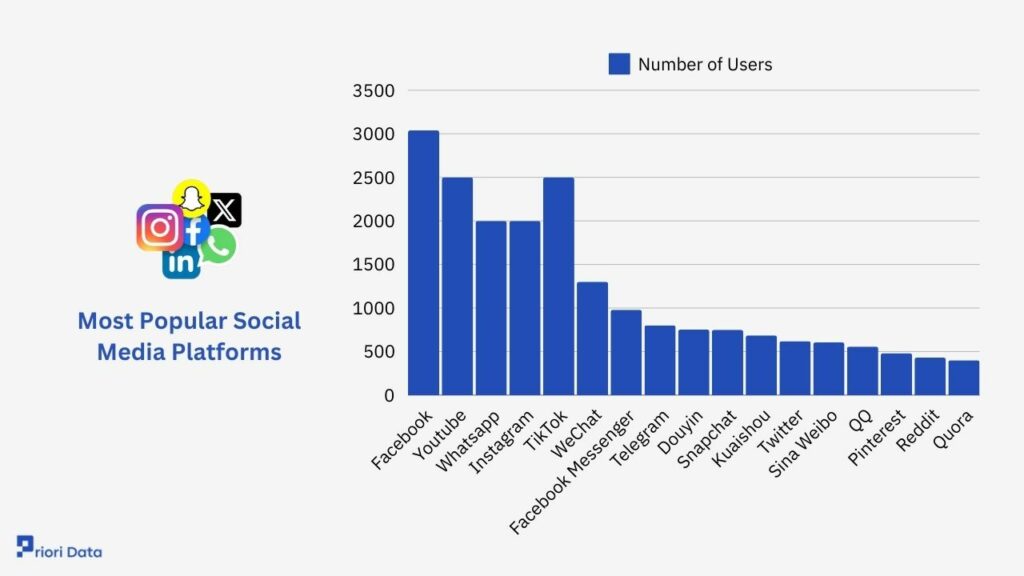
- Facebook leads the pack with 3.04 billion users, maintaining its position as the most extensive social networking site globally.
- YouTube follows with 2.5 billion users, reinforcing its status as the premier platform for video sharing and consumption.
- WhatsApp and Instagram are tied in the third position, each with 2 billion users. WhatsApp is renowned for its messaging services, while Instagram is a favorite for photo and video sharing.
- TikTok, with 1.5 billion users, rounds out the top five, showcasing its rapid rise as a leading platform for short-form video content.
Most Popular Social Media Platforms
| Social Media Platform | Number of Users |
|---|---|
| 3.04 billion | |
| Youtube | 2.5 billion |
| 2 billion | |
| 2 billion | |
| TikTok | 1.5 billion |
| 1.3 billion | |
| Facebook Messenger | 979 million |
| Telegram | 800 million |
| Douyin | 752 million |
| Snapchat | 750 million |
| Kuaishou | 685 million |
| 619 million | |
| Sina Weibo | 605 million |
| 558 million | |
| 482 million | |
| 430 million | |
| Quora | 400 million |
Source: Statista, Datareportal
How Many Accounts Does An Average Social Media User Have?
Typically, a social media user visits an average of 7.2 different social platforms every month.
Average Social Media Accounts Per Person
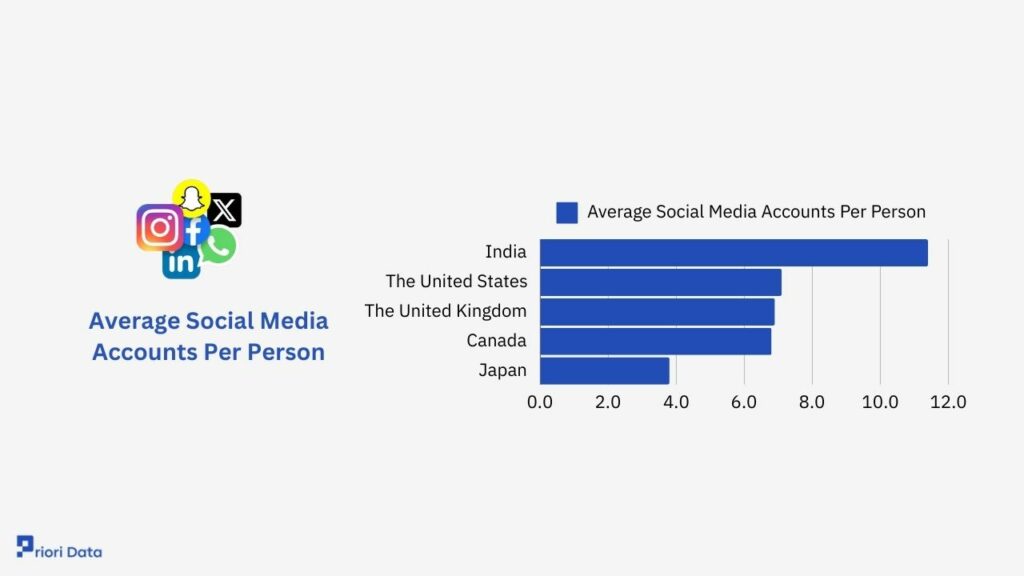
- In India, the average social media user holds the highest number of accounts, with 11 per person. This suggests a highly diversified use of social media platforms among the Indian population.
- Following India, the United States sees its average social media user managing 7 accounts, indicating a strong engagement with multiple social media platforms.
- The United Kingdom also has an average of 7 accounts per person, closely paralleled by Canada, where individuals typically have 7 social media accounts.
- Japan has the lowest average on this list, with 4 social media accounts per person, suggesting a more concentrated or selective use of social media platforms among the Japanese population.
| Country | Average Social Media Accounts Per Person |
|---|---|
| India | 11.4 |
| The United States | 7.1 |
| The United Kingdom | 6.9 |
| Canada | 6.8 |
| Japan | 3.8 |
How Much Time Do People Spend On Social Media Per Day?
- The average daily time spent on social media was 2 hours and 23 minutes worldwide.
- 7 in 10 U.S. adults used social media, with around 49% saying they used it daily.
- The average American spent around 2 hours and 8 minutes per day on social media.
- People aged 16-24 spent the most time on social media at an average of 3 hours and 38 minutes per day.
Time Spend per day by region
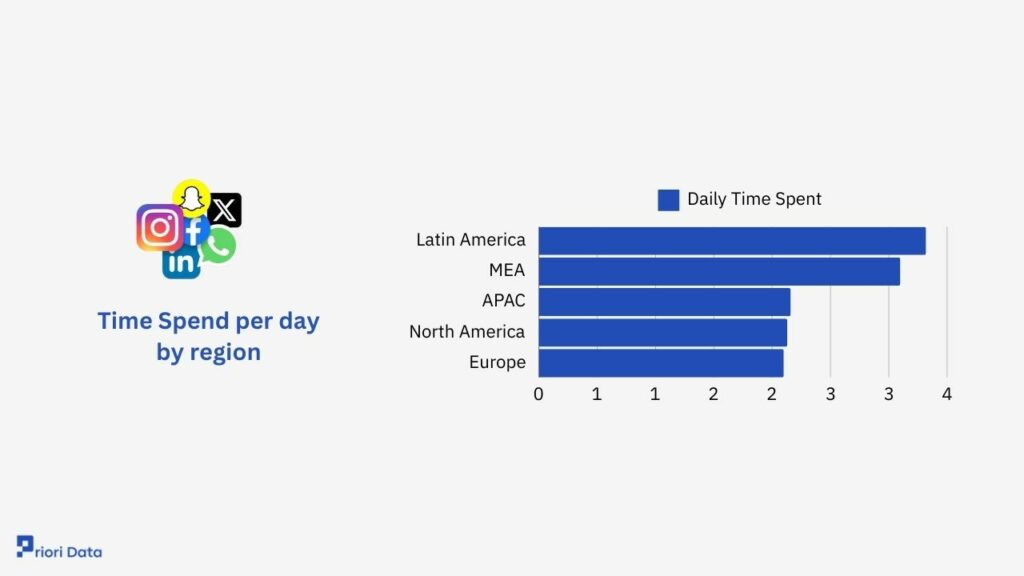
- Latin America leads in social media usage, with individuals spending an average of 3 minutes and 32 seconds daily. This suggests a high level of engagement with social media platforms in this region.
- In the Middle East and Africa (MEA), the daily time spent is slightly lower, averaging 3 minutes and 10 seconds. This still indicates a significant use of social media among its population.
- The Asia-Pacific (APAC) region sees its users spending 2 minutes and 16 seconds on social media daily, showcasing moderate engagement compared to other areas.
| Region | Daily Time Spent |
|---|---|
| Latin America | 3 min 32 seconds |
| MEA | 3 min 10 seconds |
| APAC | 2 min 16 seconds |
| North America | 2 min 13 seconds |
| Europe | 2 min 10 seconds |
Sources: SmartInsight, GWI
Time Spend per day by Country
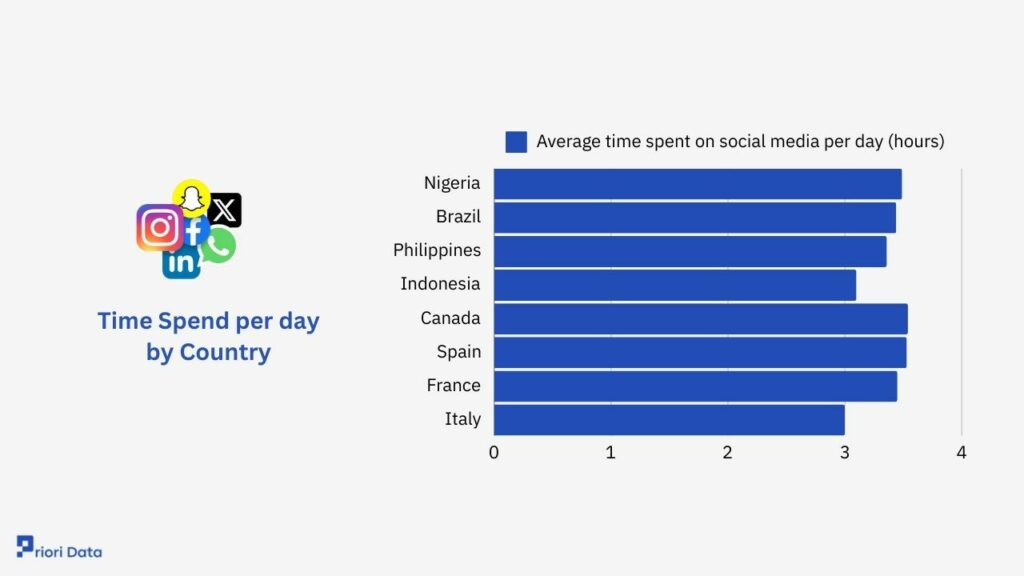
- Canada reports the highest daily usage, with individuals spending an average of 3 hours and 54 minutes on social media. This indicates a significant portion of the day is dedicated to engaging with social media platforms.
- Following closely is Spain, where the average time spent is 3 hours and 53 minutes, showcasing a similarly high level of social media interaction among its population.
- In Nigeria, users spend 3 hours and 49 minutes per day on social media, placing it third on the list and highlighting the important role of social media in daily communication and entertainment.
- France sees its users engaging with social media for 3 hours and 45 minutes daily, while Brazil has a slightly lower average of 3 hours and 44 minutes.
| Country | Average time spent on social media per day |
|---|---|
| Nigeria | 3 hr and 49 min |
| Brazil | 3 hr and 44 min |
| Philippines | 3 hr and 36 min |
| Indonesia | 3 hr and 10 min |
| Canada | 3 hr and 54 min |
| Spain | 3 hr and 53 min |
| France | 3 hr and 45 min |
| Italy | 3 hr and 41 min |
Which Country Has the Most Social Media Users?
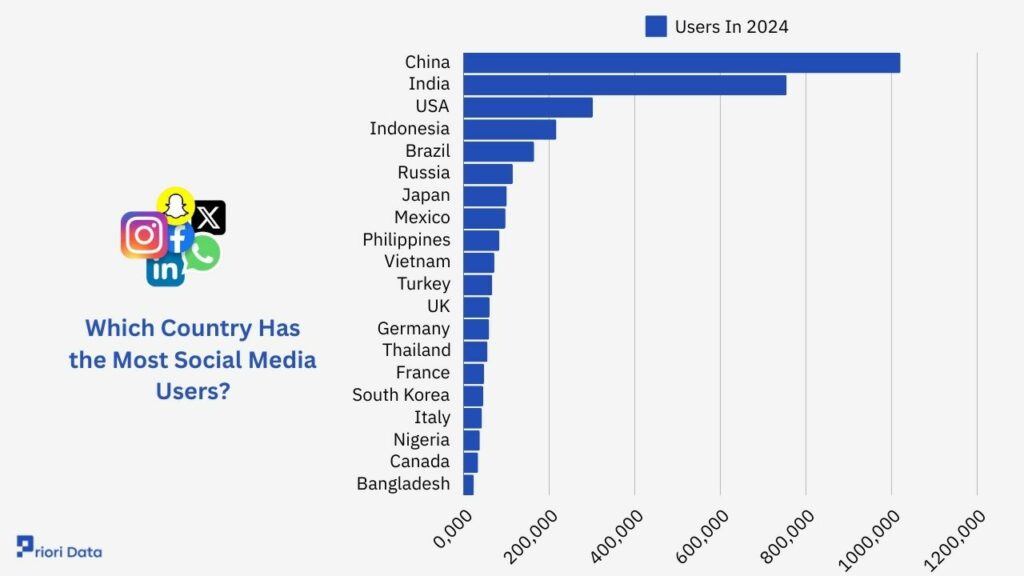
- China leads significantly with 1,021 million users in 2024, and it’s predicted to grow to 1,212 million by 2027.
- India follows with 755 million users in 2024, with a substantial predicted increase to 1,177 million by 2027.
- The United States is third, with 302 million users in 2024 and a predicted rise to 327 million by 2027.
| Country | Users In 2024 | Predicted number of users by 2027 |
|---|---|---|
| China | 1,021 million | 1,212 million |
| India | 755 million | 1,177 million |
| USA | 302 million | 327 million |
| Indonesia | 217 million | 261 million |
| Brazil | 165 million | 188 million |
| Russia | 115 million | 126 million |
| Japan | 101 million | 113 million |
| Mexico | 98 million | 122 million |
| Philippines | 84 million | 92 million |
| Vietnam | 72 million | 81 million |
| Turkey | 67 million | 76 million |
| UK | 61 million | 65 million |
| Germany | 60 million | 73 million |
| Thailand | 56 million | 59 million |
| France | 48 million | 56 million |
| South Korea | 46 million | 47 million |
| Italy | 43 million | 46 million |
| Nigeria | 38 million | 91 million |
| Canada | 34 million | 39 million |
| Bangladesh | 24 million | 34 million |
World Regions With The Most Social Media Users In 2024
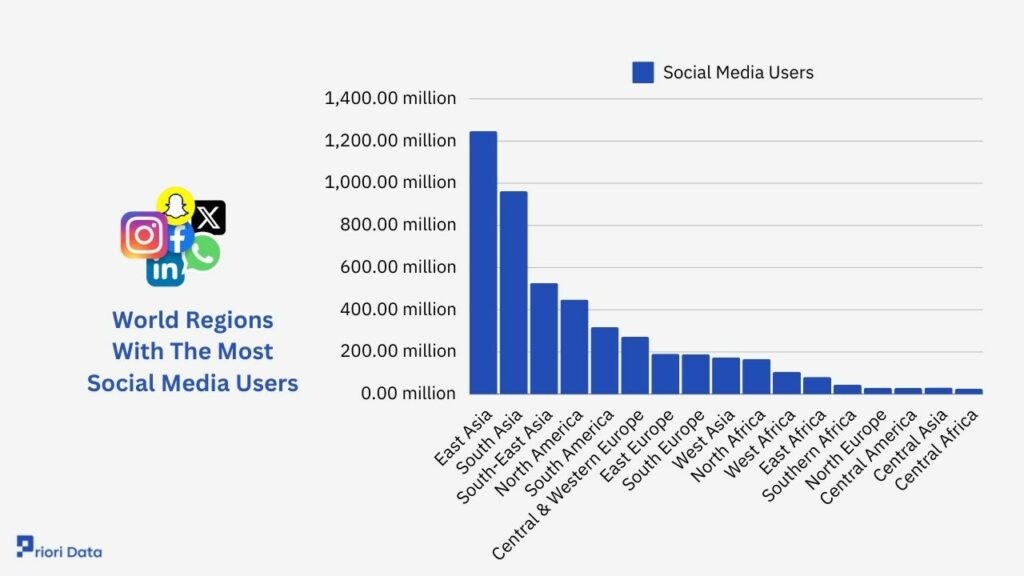
- East Asia, leading significantly with approximately 1,246.98 million social media users.
- South Asia, following with 961.81 million users.
- South-East Asia, ranking third with 527.23 million social media users.
| World Region | Social Media Users |
|---|---|
| East Asia | 1,246.98 million |
| South Asia | 961.81 million |
| South-East Asia | 527.23 million |
| North America | 447.82 million |
| South America | 316.78 million |
| Central & Western Europe | 271.29 million |
| East Europe | 191.31 million |
| South Europe | 189.28 million |
| West Asia | 173.9 million |
| North Africa | 166.18 million |
| West Africa | 105.91 million |
| East Africa | 80.82 million |
| Southern Africa | 44.71 million |
| North Europe | 29.68 million |
| Central America | 28.99 million |
| Central Asia | 31.11 million |
| Central Africa | 24.71 million |
Source: Statista.
Social Media Users by Gender
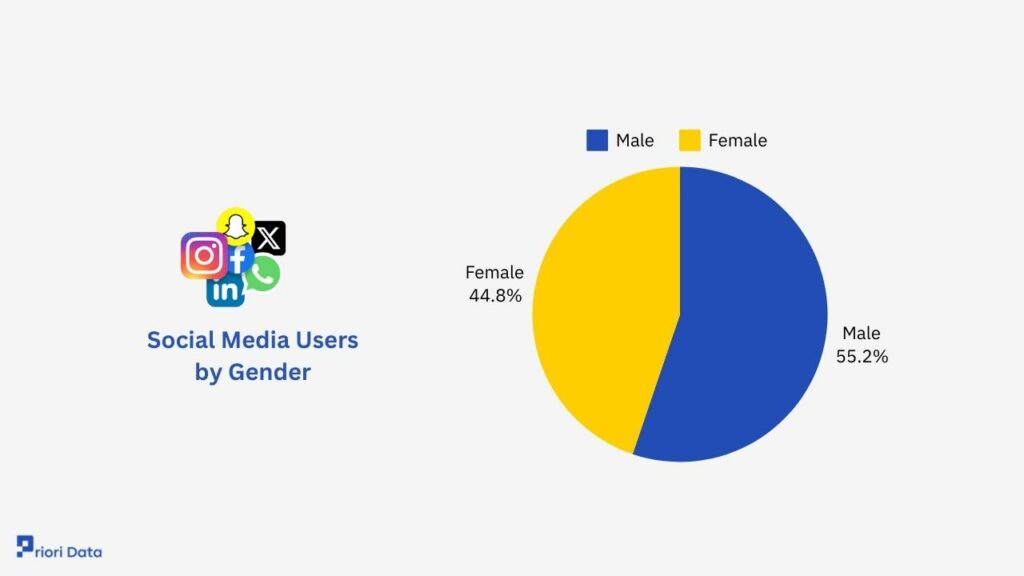
There are 2.65 billion male and 2.15 billion female social media users globally.
| Gender | Number Of Social Media Users |
|---|---|
| Male | 2.65 billion |
| Female | 2.15 billion |
Social media users across world regions by Gender:
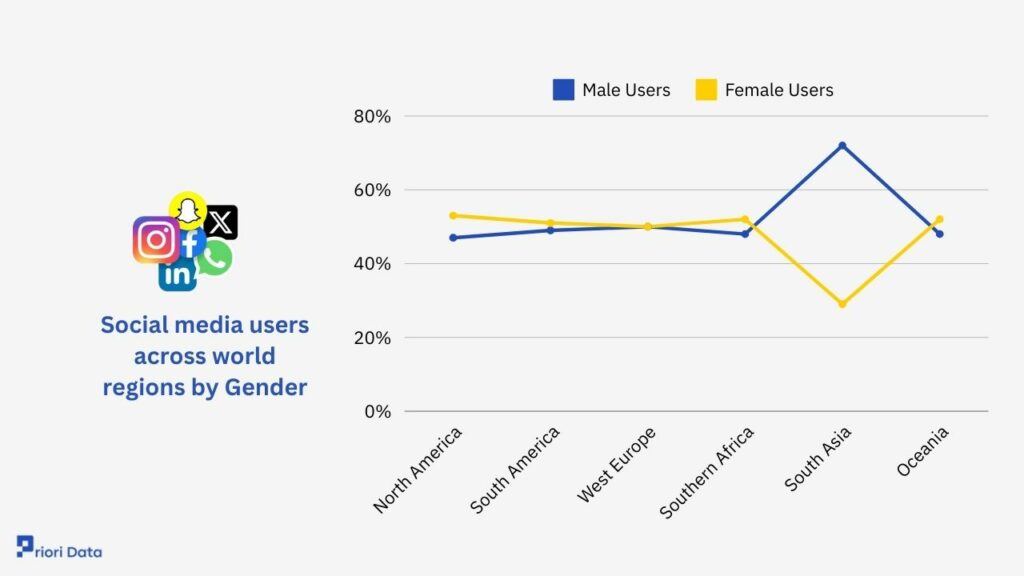
- In North America, males account for 47% and females for 53% of social media users.
- South America sees a distribution of 49% male and 51% female users.
- West Europe presents an equal split with 50% male and 50% female users.
- In Southern Africa, the ratio is 48% male to 52% female.
- South Asia has a notable disparity with 72% male and only 28% female users
- Oceania shows a balance similar to North America and Southern Africa, with 48% male and 52% female users.
| World Region | Male Users | Female Users |
|---|---|---|
| North America | 47% | 53% |
| South America | 49% | 51% |
| West Europe | 50% | 50% |
| Southern Africa | 48% | 52% |
| South Asia | 72% | 29% |
| Oceania | 48% | 52% |
Social media users of top social media platforms by Gender:
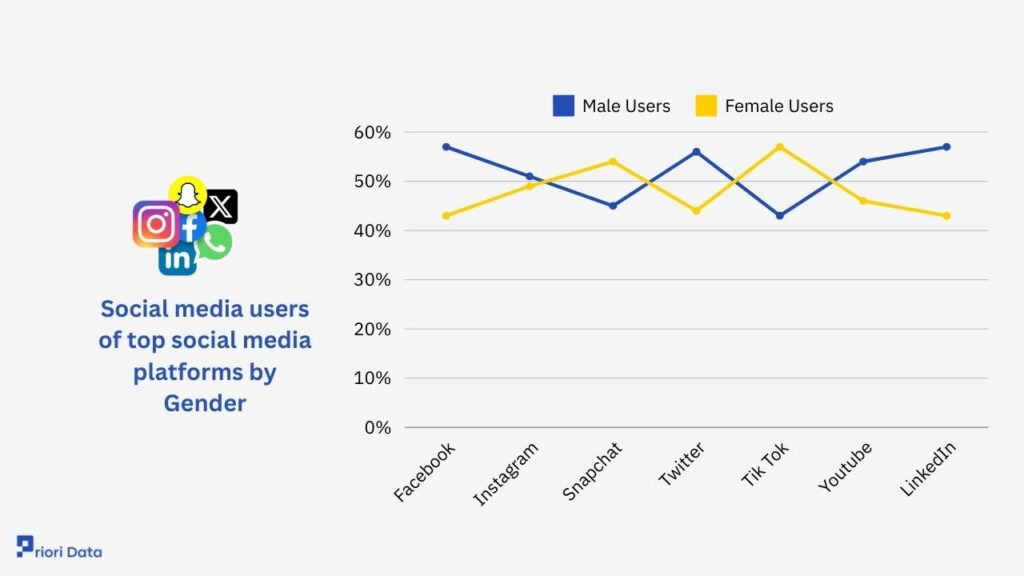
- On Facebook, 57% of users are male and 43% are female.
- Instagram has a closer gender distribution with 51% male and 49% female users.
- Snapchat sees a majority of female users at 54%, compared to 45% male.
- Twitter’s user base comprises 56% male and 44% female.
- TikTok favors a female majority at 57%, against 43% male.
- YouTube shows a distribution of 54% male to 46% female.
- LinkedIn, similar to Facebook, has a user base of 57% male and 43% female.
| Platform | Male Users | Female Users |
|---|---|---|
| 57% | 43% | |
| 51% | 49% | |
| Snapchat | 45% | 54% |
| 56% | 44% | |
| Tik Tok | 43% | 57% |
| Youtube | 54% | 46% |
| 57% | 43% |
Social Media Penetration By Country In 2024
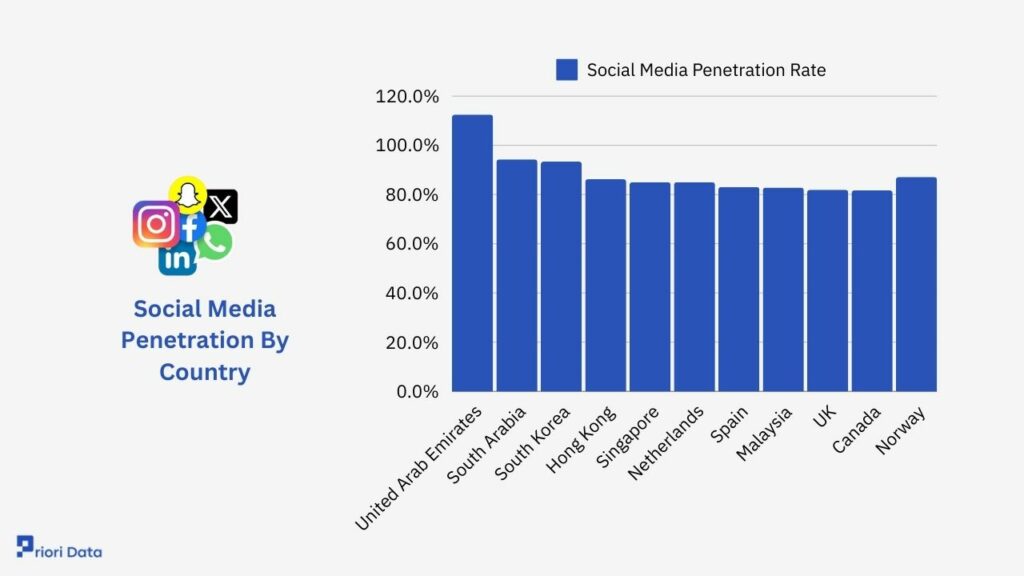
The United Arab Emirates had the world’s highest social media penetration rate at 112.5% of the population actively using platforms.
Saudi Arabia (94.3% active usage) and South Korea (93.4%) followed as countries with very high social media usage rates.
Some of the lowest social network penetration rates were in Kenya, Ghana, and Nigeria with less than 24% of the population accessing social media in each country.
Globally, the average rate of active social media usage was 62.3% as of early 2024. This means around 6 out of every 10 people worldwide used social networking platforms.
| Country | Social Media Penetration Rate |
|---|---|
| United Arab Emirates | 112.5% |
| South Arabia | 94.3% |
| South Korea | 93.4% |
| Hong Kong | 86.2% |
| Singapore | 85% |
| Netherlands | 85% |
| Spain | 83.1% |
| Malaysia | 82.8% |
| UK | 81.9% |
| Canada | 81.7% |
| Norway | 87.1% |
Source: Statista
Social media penetration rate by world regions:
Highest Social Media Usage Regions in January 2024
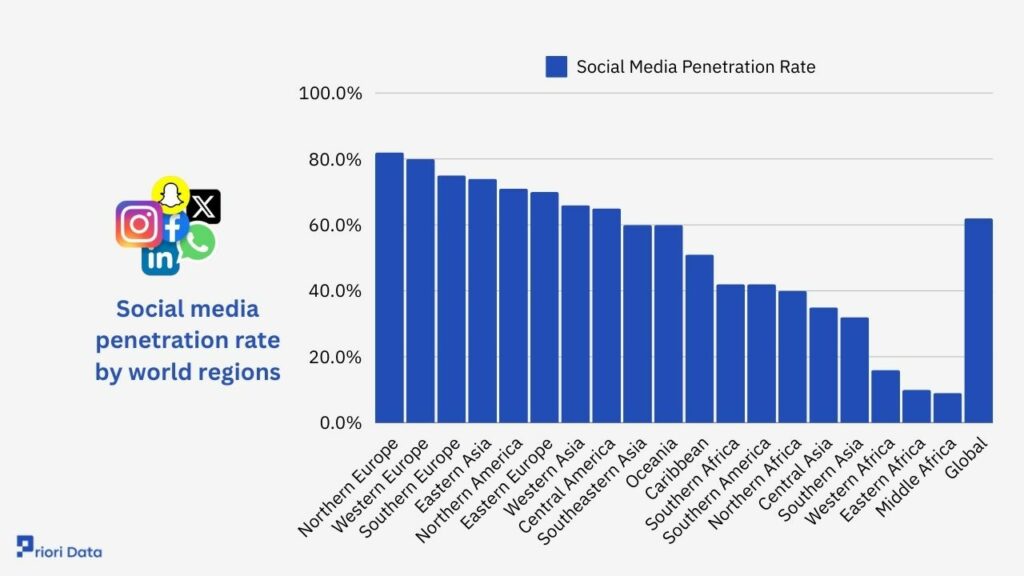
Northern Europe had the highest social media penetration globally, with 81.7% of the population using social networks.
Western Europe followed closely with 80.2% usage.
In Southern Europe, 74.8% used social media, placing the region third highest.
Lowest Social Media Usage Regions
On the opposite end, Eastern Africa and Middle Africa exhibited the lowest social media reach worldwide at just 10.1% and 9.6% respectively.
Global Average Social Media Usage
Across the globe, the average social network penetration rate was 32.3% as of January 2024.
This translates to about 6 out of every 10 people around the world using social media platforms. All regions falling below this global average were located in Africa and Asia, with the exception of the Caribbean.
Social media penetration rate by world regions:
| World Region | Social Media Penetration Rate |
|---|---|
| Northern Europe | 82% |
| Western Europe | 80% |
| Southern Europe | 75% |
| Eastern Asia | 74% |
| Northern America | 71% |
| Eastern Europe | 70% |
| Western Asia | 66% |
| Central America | 65% |
| Southeastern Asia | 60% |
| Oceania | 60% |
| Caribbean | 51% |
| Southern Africa | 42% |
| Southern America | 42% |
| Northern Africa | 40% |
| Central Asia | 35% |
| Southern Asia | 32% |
| Western Africa | 16% |
| Eastern Africa | 10% |
| Middle Africa | 9% |
| Global | 62% |
Source: Statista.
Social Media Statistics For USA
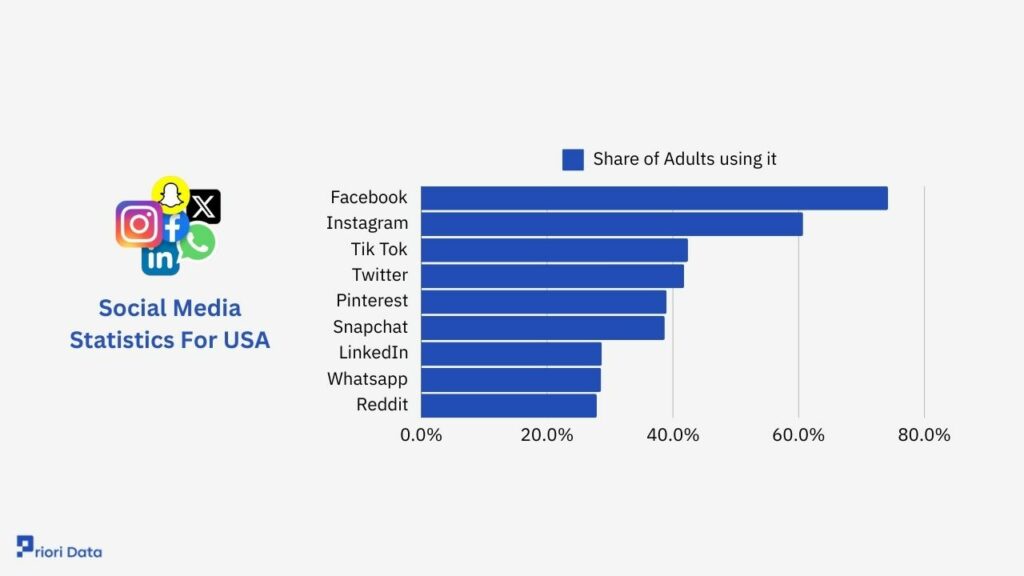
Facebook leads the pack with a significant 74.2% of adults reporting its use, underscoring its dominance as the most widespread platform in the United States.
Instagram follows with a substantial 60.7% share, indicating its strong appeal, particularly for sharing photos and videos.
TikTok, a newer entrant compared to the others, has quickly captured the attention of 42.4% of adults, showcasing its rapid growth and popularity, especially among younger demographics.
Close behind, Twitter is used by 41.8% of adults, serving as a key platform for real-time news and social commentary.
Lastly, Reddit captures 27.9% of adults, emphasizing its role as a community-driven discussion platform.
| Platform | Share of Adults using it |
|---|---|
| 74.2% | |
| 60.7% | |
| Tik Tok | 42.4% |
| 41.8% | |
| 39.0% | |
| Snapchat | 38.7% |
| 28.7% | |
| 28.6% | |
| 27.9% |
Stats by Gender
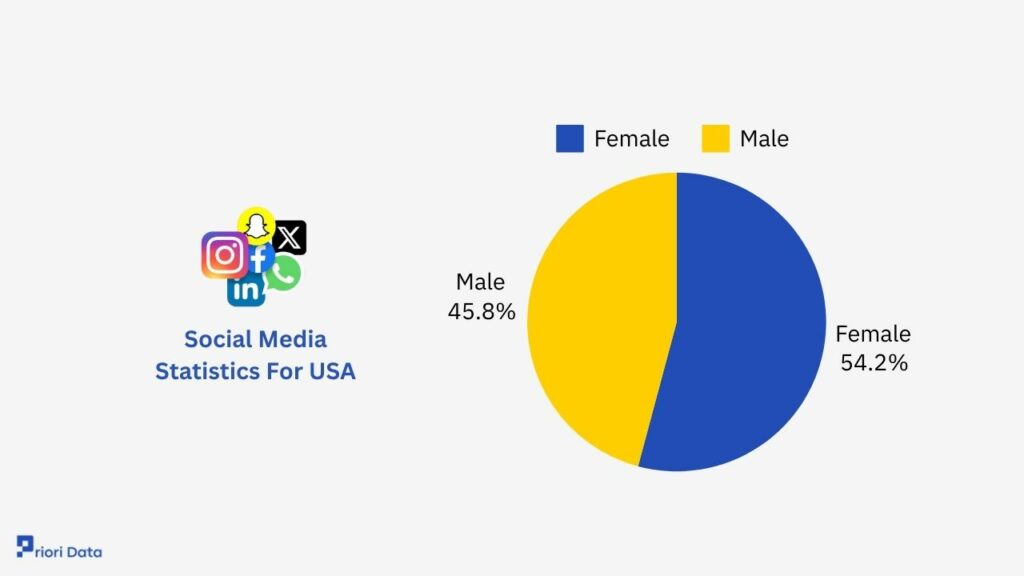
78% of females in the US are using social media, compared to 66% of males. This indicates that a higher percentage of females engage with social media platforms than males.
| Gender | Percentage |
|---|---|
| Female | 78% |
| Male | 66% |
Age of Social Media Users in the USA
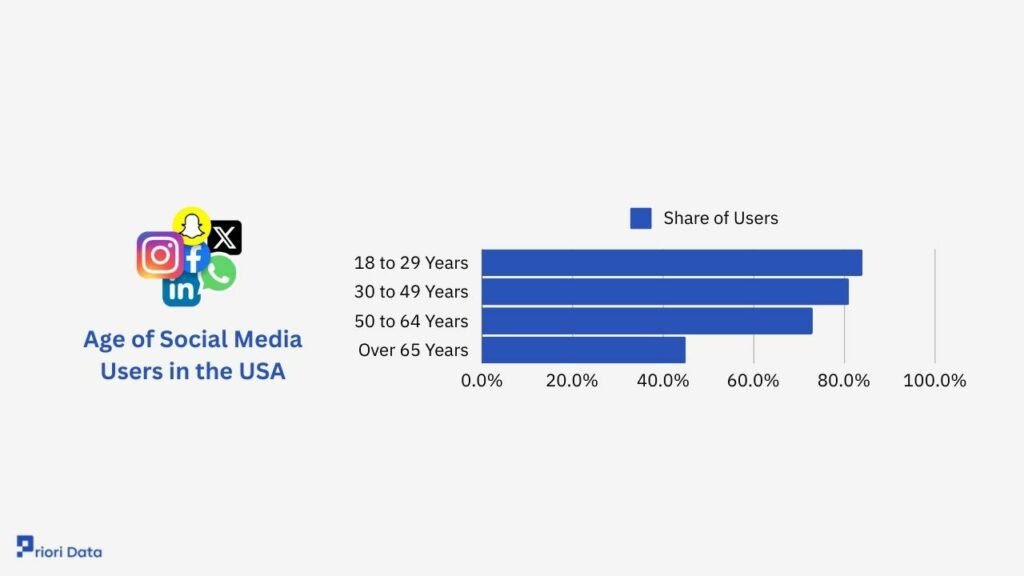
The distribution of social media users in the USA by age group reveals a clear trend: younger people are more likely to use social media compared to older generations.
Specifically, 84% of those aged 18 to 29 years use social media, a figure that slightly decreases to 81% for the 30 to 49 age group.
Usage continues to drop among older demographics, with 73% for those aged 50 to 64 years, and only 45% of individuals over 65 years engaging with social media platforms.
This pattern illustrates how social media engagement diminishes with age, indicating its higher integration into the lifestyles of younger adults.
| Age Group | Share of Users |
|---|---|
| 18 to 29 Years | 84% |
| 30 to 49 Years | 81% |
| 50 to 64 Years | 73% |
| Over 65 Years | 45% |
Source:Statista, Pew Research, Backlinko.
Stats by Ethnicity
Social media usage in the USA varies by ethnicity, with Hispanic individuals leading at an 80% usage rate.
Black individuals follow closely at 77%, while White individuals have a slightly lower engagement rate of 69%.
| Ethnicity | Percentage |
|---|---|
| Hispanic | 80% |
| Black | 77% |
| White | 69% |
Most Popular Social Media Sites in the US
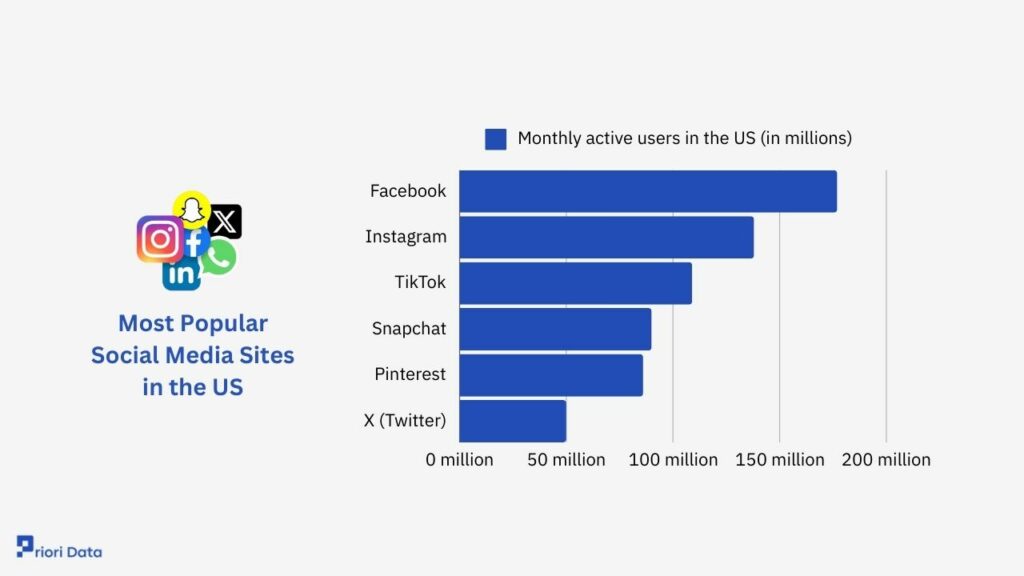
In the US, the number of people using different social networks each month is quite different.
Facebook leads with 177 million users.
Instagram is next, with 138 million people using it.
TikTok has quickly become popular, having 109 million users. Snapchat is also widely used, with 90 million people on it.
Pinterest has a strong following too, with 86 million users.
X (previously known as Twitter) has a smaller, but still significant, user base of 50 million.
This shows how different platforms appeal to different audiences across the country.
| Social network | Monthly active users in the US (in millions) |
|---|---|
| 177 million | |
| 138 million | |
| TikTok | 109 million |
| Snapchat | 90 million |
| 86 million | |
| X (Twitter) | 50 million |
Source: Emarketer
How Often Do Americans Use Social Media Sites?
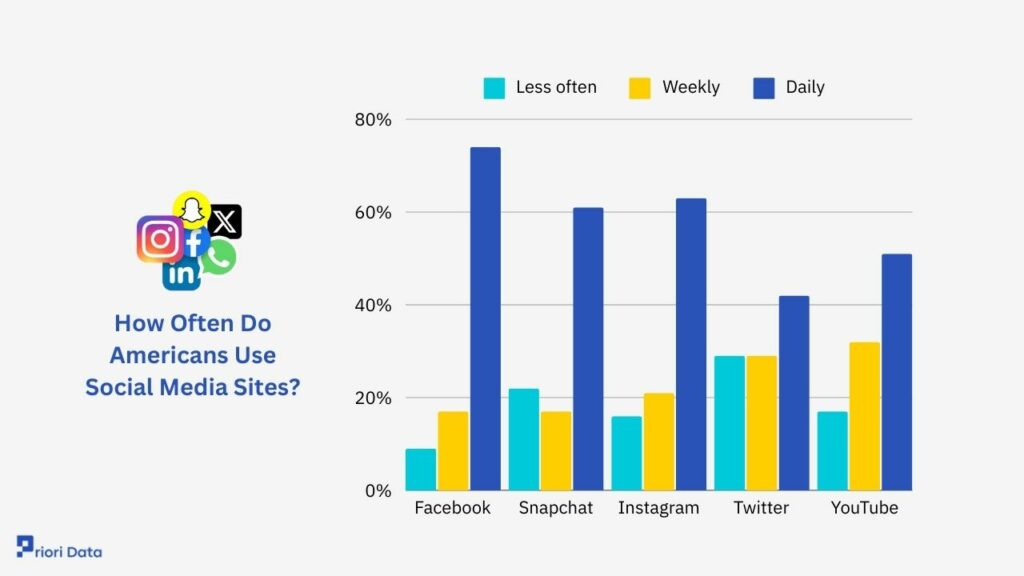
- Facebook sees the highest daily engagement, with 74% of its users logging in daily, while only 9% use it less often. This indicates a strong daily usage habit among Facebook users.
- Snapchat has 61% of its users checking in daily. Despite a significant daily user base, a larger portion of its users are less frequent visitors compared to Facebook.
- Instagram features a similar pattern to Snapchat with 63% daily users, 21% using it weekly, and 16% less often.
- Twitter shows more balanced usage with 42% daily users, 29% weekly, and 29% using it less often.
| Platform | Less often | Weekly | Daily |
|---|---|---|---|
| 9% | 17% | 74% | |
| Snapchat | 22% | 17% | 61% |
| 16% | 21% | 63% | |
| 29% | 29% | 42% | |
| YouTube | 17% | 32% | 51% |
Sources:GlobalWebIndex, DataReportal
Social Media Timeline
1997
- SixDegrees.com was launched in May, considered the first social media site, allowing users to create profiles and lists of friends.
1998
- Open Diary established the first social blogging network, pioneering reader comments and friend-only content.
1999
- YouthStream Media Networks acquired SixDegrees.com for $125 million.
- Yahoo! Messenger and MSN Messenger were launched.
2000
- Habbo, a game-based social networking site, was launched.
2001
- SixDegrees.com shut down.
- Windows Messenger was made available and included with Windows XP.
2002
- Friendster, a social networking site based on the Circle of Friends concept, was launched.
2003
- LinkedIn, a career-oriented social networking service, was launched.
- MySpace, one of the first massively popular social networking sites, was founded.
- Skype was launched.
2004
- Facebook, the world’s most popular social networking service today, was launched.
- Flickr, an online photo-sharing platform, was launched.
- Google launched Orkut, a social networking website.
- News Corporation acquired MySpace for $580 million.
2005
- Qzone, a Chinese social networking site, went live.
- Reddit, a social news and discussion website, was founded.
- YouTube, the video-sharing platform, was launched.
- Yahoo! acquired Flickr.
2006
- Twitter, the microblogging platform, was launched.
- VK (VKontakte), a popular Russian social networking platform similar to Facebook, was launched.
- Facebook launched its News Feed feature.
2007
- Tumblr, a microblogging and social networking platform, was launched.
2009
- Sina Weibo, a Chinese microblogging network, went live.
2010
- Pinterest made its debut.
- Instagram was launched.
- Quora was launched.
2011
- Snapchat was launched.
- Microsoft acquired Skype for $8.5 billion.
- Google+ was launched.
- News Corp. sold MySpace to Specific Media for $35 million.
- LinkedIn issued its IPO.
- Twitch, a live streaming platform for gamers, was launched.
2012
- Facebook went public with its IPO.
- Snapchat was launched.
- Tinder, a dating app, was launched.
- Facebook acquired Instagram for $1 billion.
2013
- Vine, a short-form video hosting service, was launched and quickly acquired by Twitter for $30 million.
- Twitter filed for its IPO.
- Google Hangouts was launched.
- Myspace relaunched with a redesigned website and mobile app.
2014
- Musical.ly, a video social networking app, was launched.
- Amazon acquired Twitch for $970 million.
- Google shut down Orkut.
2015
- Periscope, a live video-sharing app, was launched and quickly acquired by Twitter.
- Discord, a voice and text chat app, was launched.
2016
- Yahoo! Messenger stopped its services for Mac, Windows, Solaris, and Linux users, supporting only Android, iOS, and web clients.
- Time Inc. bought Myspace and its parent company.
2017
- Instagram Stories surpassed Snapchat in daily active users.
- ByteDance acquired Musical.ly for $1 billion.
- Snapchat filed for its IPO.
- TikTok was launched.
2018
- Yahoo! Messenger was shut down.
- Musical.ly shut down and migrated its users to TikTok.
- IGTV, a standalone video application by Instagram, was launched.
2019
- Google+ was shut down.
2020
- Clubhouse, an audio-based social networking app, was launched.
2021
- Donald Trump was banned from major social media platforms after the Capitol riots.
- TikTok became the most popular website, surpassing Google.
2022
- Elon Musk acquired Twitter for $44 billion.
- BeReal, an authentic social media app, gained popularity among Gen Z.


