

The term “AI data analysis” describes the use of artificial intelligence (AI) tools and algorithms to analyze, test, and draw valuable insights even from complicated information.
AI also facilitates data analysis by consolidating all data into a single solution, providing consumers with a thorough understanding of the data.
You can gain the insights you need to achieve your goals by using a variety of tools for data visualization, analysis, and tracking.
Best AI Data Analytics Tools
1. MonkeyLearn
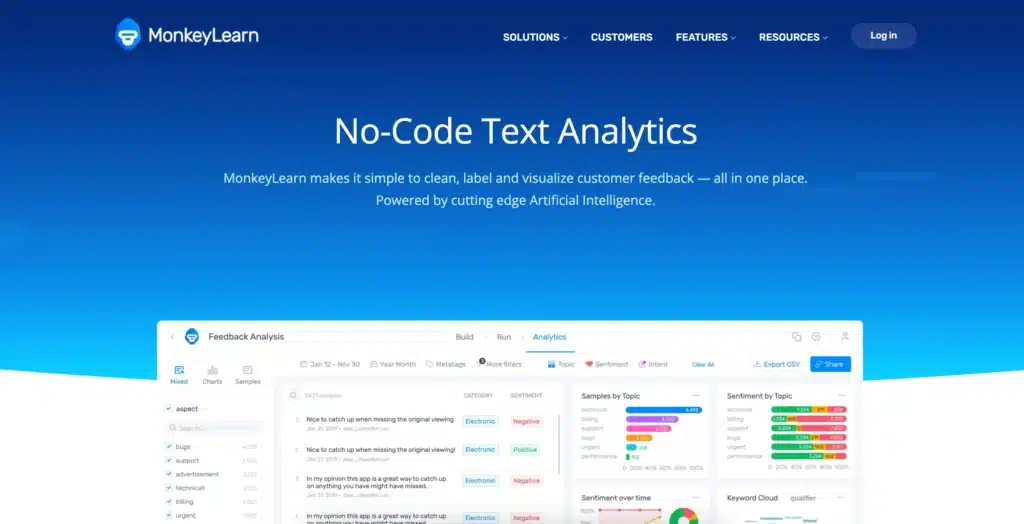
MonkeyLearn is a text and data analysis tool driven by AI that aids in the extraction of insights from unstructured text.
The platform includes a variety of text analysis tools powered by AI that can analyze and show data to suit the needs of the user.
Text classifiers and text extractors may be configured to categorize data by the appropriate subject or intent and pull user or product data.
The capability of MonkeyLearn to gather data from tickets as they are received is one of the features that consumers like using the most.
Features:
Detailed insights on data:
Studio for data visualization and text analysis in one. Run a data analysis to get immediate insights.
Custom machine-learning models:
Use pre-built machine learning models or create your own that don’t need any coding.
Business templates:
Use templates that are prepared with ready-made text analysis models and are adapted for various business contexts.
Predict and prevent:
Learn about and keep track of client opinions over time by topic. Determine and address customer churn warning signs.
Pricing:
MonkeyLearn provides a free plan along with many premium options according to your needs, including a Team plan for $299.
Pros:
- Increases productivity and efficiency by quickening processes.
- Ensures simple operation and navigation, cutting down on the time needed for platform training and acclimatization.
- Deepens understanding of how customers perceive brands and enhance customer relationships.
Cons:
- It could be difficult for non-technical users to initially become accustomed to the program.
- The gratis bundle might not have all of the necessary features.
2. Tableau
Tableau, a well-known business intelligence and data visualization application, helps you analyze, understand, and convey your data. It offers cutting-edge dashboards and visuals that help customers understand complicated datasets.
It enables data visualization to produce reports that can be distributed. Another feature that will be introduced and made available across Desktop products is Tableau Pulse.
Tableau gives users the option of using the platform on-premises or in the cloud if they choose a more secure environment for their data.
Features:
Data management:
To manage, link, and trust your analytics data, combine the strength of data flows, preparation, and cataloging.
In-built cloud:
The self-service platform is quick, adaptable, and simple to use. data preparation, authoring, analysis, collaboration, publishing, and sharing in the cloud.
Advanced management:
To allow real self-service analytics at scale, streamline your content management procedures.
Desktop version:
Data access, visualization, and analysis. You may find hidden insights and make wiser judgments using a simple drag-and-drop interface.
Pricing:
Tableau provides three different subscription plans along with a free trial. However, they did not disclose the exact cost for each plan but the three plans are Tableau Creator, Explorer, and Viewer. Students and teachers get to download a free one-year version of Desktop, Prep, and eLearning.
Pros:
- Tableau provides interactive dashboards for displaying data.
- Data encryption and multi-factor authentication are examples of strong security features.
Cons:
Tableau does not offer the option to update reports using scheduling.
3. Polymer
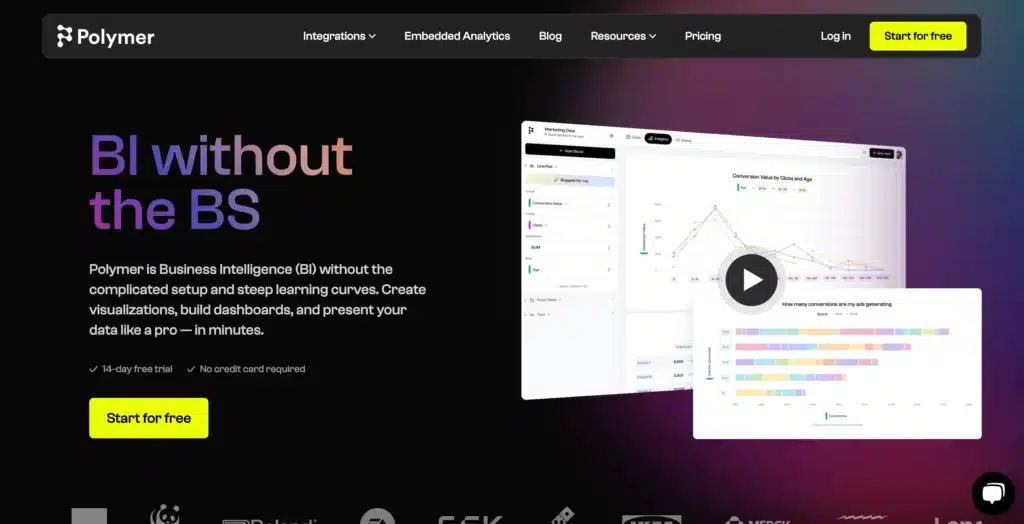
With the help of Polymer Search, you can transform your monotonous data into a more efficient, effective, and adaptable database.
By creating graphs, tables, and maps from your data source, Polymer facilitates data exploration. send the spreadsheet to Polymer, and it will be transformed into a well-structured database that is easy to use.
With its design and easy setup, Polymer serves a wide range of professionals, including data analysts, digital marketers, and content developers.
Features:
Use the AI guide:
Your data is analyzed by Polymer’s AI, which then creates stunning dashboards and suggests insightful information.
Share your data anywhere:
Share a dashboard link in a flash, including a particular chart in a slide show, or embed your data anywhere.
E-commerce:
Connect your data to Polymer whether you use Shopify or another e-commerce platform to learn more about consumer trends and buying habits.
Marketing data:
To find the top-performing creatives and to make the most of your spending, use data from Google, Facebook, and other advertising platforms.
Pricing:
Polymer provides three subscription plans starting along with a 14-day free trial from $20 for the starter, Pro at $40, and Enterprise at $500.
Pros:
- Dependable AI technology that converts data into a database.
- Enhances user knowledge by analyzing data.
- Creates dynamic, searchable spreadsheets.
Cons:
- Not able to handle huge data and having little flexibility for more complex systems.
4. Power BI
Microsoft offers a business intelligence software called Power BI. For data visualization, dashboard creation, and insight sharing, it provides data analytics tools and services.
Users of the platform may start creating reports and dashboards after importing data from almost any source.
Users may use various AI-powered features and develop machine-learning models to aid in the analysis of their data. Using Microsoft Power BI can help you comprehend, communicate, and analyze your data better.
Features:
Secure junction:
The Power BI data hub allows you to construct datasets from any data source and upload them there to create a safe space.
Insights with visuals:
Utilizing cutting-edge data analysis capabilities and a simple drag-and-drop report canvas, you can transform your raw data into captivating graphics.
Translate insights into impact:
Incorporate insights into the programs you already use, like Microsoft 365, to speed up the conversion of insights into choices.
Connect with other apps:
By integrating Power Automate with the Microsoft Power Platform, Microsoft 365, Dynamics 365, Azure, and countless more apps, you can create end-to-end business solutions.
Pricing:
Microsoft Power BI provides three subscription plans starting at $9.50 which is the Power BI Pro per month, and Power BI Premium at $ 18.99 per user/month. You can also use Power BI for free by signing up and downloading the Desktop version.
Pros:
- Access to databases on-premises, cloud services, streaming data, and Excel spreadsheets.
- Tools for data visualization that use natural language processing.
- Use REST API to integrate with most programs and services.
- With the publish-to-web capability, you may publish data straight from a service.
Cons:
- Power BI Desktop works well on Windows, iOS, and Android, but neither Mac nor Linux has a desktop version.
- Many customers complain of connection issues, sluggish performance, and time-outs while working with massive datasets.
5. Knime
KNIME is the best solution for data analysts looking for a comprehensive, collaborative AI platform. It is integrated with many machine learning frameworks and approaches, users may personalize their experience and have freedom.
Its interface and adaptable design enable you to use it to build bespoke data pipelines and workflows for a range of data analysis tasks.
Additionally, KNIME provides users with access to many strong analytics tools from its integrated library of nodes from several open sources and libraries like R or Python.
Features:
Visual workflows:
Automate manual data entry and other repeated manual chores. Use cutting-edge methods and big datasets without writing any code.
Advanced analytics:
Use an open ecosystem to access all well-known AI/ML libraries. Expand your platform by adding unique KNIME nodes.
Dashboards & interactive data apps:
Learn from powerful analytics without writing any code. Analytical models should incorporate domain knowledge.
Secure and centralized:
On a single, centralized platform, manage access for data security and governance. On-site or in the cloud, launch, and scale with flexibility.
Pricing:
KNIME provides many subscription plans but one needs to contact directly with the company for the price. There are 5 plans, Individual, Team, Basic, Standard, and Enterprise.
Pros:
- It is available to everyone for free and is open source.
- Visual interface that is simple to use with drag-and-drop capabilities.
- A sizable and vibrant community that offers plenty of services and help.
Cons:
- KNIME falls short in the area of geographic data analysis because it lacks specific modules.
6. Qlik
Qlik is a strong analytics and business intelligence (BI) platform with AI capabilities. Users of the Qlik Analytics Platform can create, expand, and incorporate visual analytics into already-existing applications.
On the platform, teams may interact while using data to their preferences using straightforward drag-and-drop editors.
You can examine your data and find patterns using Qlik’s guided data exploration feature—all without having to write any code.
Even if you’ve never performed data analysis before, you can use it straight away because it’s made to be.
Features:
Self-service Visualization:
Regardless of how much (or little) data you have, you can combine, load, display, and analyze it.
Dashboards:
Dashboards become an effective starting point for smarter, data-driven decision-making using Qlik Sense.
Reporting:
Create, publish, and distribute reports in file types including PDFs and Microsoft® Office. The design and formatting options provided by Qlik Sense Analytics are quite customizable.
Custom and embed:
Create customized applications, fresh visualizations, and expansions, or integrate completely interactive analytics into the applications.
Pricing:
Qlik provides three subscription plans along with free and demo versions before subscription. The Standard plan starts at $20 per user/month, Premium at $2,700 per month, and for Enterprise pricing contact directly with the company from their official site.
Pros:
- Qlik gives both business users and data engineers the ability to work together in a single DataOps environment.
- Users may send data with ease due to the associative data model’s interactive research and analysis capabilities.
Cons:
- Limited visualization because several fundamental charts are missing.
- When dealing with massive data quantities, data solutions are slow.
7. IBM Watson Analytics
IBM’s integrated self-service solution enables customers to access data to create reports and visualizations. Science, human-centered design, and inclusion serve as the platform’s foundations.
By incorporating AI and automation into key business activities, IBM Watson technologies help businesses reach new heights of productivity. Utilizing data is made possible by natural language processing capabilities as well.
With Watson, teams can install data-driven choices based on current insights and business knowledge. Users who use IBM Watson may automate the AI lifecycle and build robust models.
Features:
Natural Language Processing:
Users may submit inquiries using simple language, and the system will engage in a natural language to support quick searches.
Simplified analysis:
Using automated statistical analysis, IBM Watson provides a service that presents the key results on demand.
Watson(Discovery) AI feature:
With the use of powerful AI capabilities like Watson Discovery, users may label text in documents and do other tasks.
Dashboards:
Users may collaborate on visualizations and engage with data in real time using customizable dashboards.
Pricing:
For official IBM pricing, you can book a meeting or sign up for an eBook from their official
website.
Pros:
- To improve upcoming user encounters, it can be trained to focus on frequent requests.
- Organizations may predict and stop interruptions by seeing possible problems in workflows.
Cons:
A high learning curve for newbies on the network, according to some users, might make it difficult.
8. H2O.ai
H2O is a robust platform that enables the construction of many ML models. It’s a full-featured AI cloud that makes data exploration, modeling, MLOps, and deployment possible.
It includes cutting-edge visual analytics that can spot patterns fast, a simple interface for building models, and an Enterprise AI Platform, which delivers a business intelligence end-to-end governance and monitoring solution.
Accurate predictive analytics are made possible by algorithms like gradient boosting and deep learning. It’s simple to include several frameworks and languages into your workflow with H2O.ai.
Features:
Data Visualization:
Expose unexpected data quality concerns like outliers, correlations, or missing values by displaying the relevant statistical characteristics of your dataset.
Encoding:
To prepare a dataset for machine learning algorithms, convert mixed data types (such as numeric, category, text, picture, date/time, etc.).
Data Integrations:
Data scientists get access to the most recent and most effective features because of consistent and uniform storage for features and information.
Model ensembling:
To improve accuracy and ROI, many layers of assembly that is both completely automated and customized.
Pricing:
H2O provides a 90-day free trial to start your experience with the H2O AI Cloud. One can also request an H2O AI Cloud Demo to walk you through the capabilities of their platform and applications.
Pros:
- Without extensive data science knowledge, users can design and deploy models.
- Sparkling water from H2O with support for big data.
Cons:
- Accessory cutting-edge algorithms can be incorporated.
- Docker-like containerization tools should be made available.
9. RapidMiner
For users with varied levels of technical experience, RapidMiner’s interface and drag-and-drop workflow builder make it easier to do data analysis.
Even if you are new to data mining and machine learning, you may start using it right away because it is intended to be.
RapidMiner’s integrated data science platform streamlines the development of whole analytical processes, from data preparation to machine learning to model validation to deployment, in a single setting, increasing productivity and reducing the time to value for projects.
Features:
Model building:
Using automated visual and coding-based methods, you may streamline model construction regardless of your level of experience.
ML OPS:
Regardless of how complicated a model is or how it was developed, operations should be made simpler. You can deploy, assess, contrast, compare, manage, and switch out any model.
AI App structure:
Use a no-code method to provide models and insights to decision-makers and action-takers.
Collab and communication:
Open dialogue, simple sharing, and extensive reuse of work should be made possible without violating laws and rules.
Pricing:
RapidMiner did not disclose their pricing list but you can request pricing from their official website by just filling out the necessary details for registration.
Pros:
- A great graphical tool for data research is RapidMiner for Windows.
- Users may make use of this tool’s approaches and algorithms for effective analysis thanks to the wide library of pre-built AI models.
Cons:
- For the online data services, improvements are required.
10. Microsoft Excel
The well-known spreadsheet program Microsoft Excel also has AI capabilities built into its system. Users may filter through data using search boxes and pivot tables with the aid of Excel’s Data Analysis Toolpak, analyze and process their data, and generate a variety of simple visualizations.
You may ask questions about your Excel data using natural language utilizing the chat interface known as Business Chat. If you want to get insights from your data, the Excel tool called “Analyze Data” is fantastic.
Features:
Quick analysis tool:
It’s possible to add values to rows, columns, or sparklines for the data in the chosen table, apply conditional formatting, and create a chart or pivot table.
Office add-ins:
Install many specialized small applications, Office Add-ins enable to expansion of the capabilities of Excel 2019’s default features.
Integrated data:
You can develop real one-to-one and one-to-many associations between data tables imported from standalone database management systems and data lists made in Excel.
Cloud files:
Excel’s store (FileSave) and Open (FileOpen) panels make it simple to store and update your favorite spreadsheets on OneDrive.
Pricing:
Both experienced Excel users and those who are new to data analytics can enjoy using Microsoft 365 Copilot. There are two options: Microsoft 365 Family starting at $14.00 per month and Microsoft 365 Personal at $11.00 per month.
Pros:
- To make data analysis simpler, pivot tables, graphs, charts, and other models may be made using spreadsheets.
- Excel has the great benefit of being quick and easy to master.
Cons:
- Data integrity is a concern in Excel that is not present in Access.
- The storage capacity of Excel can be rather constrained because it is not designed to store big amounts of data.
How to choose the best AI Data Analytics?
1. Main Objective:
You must first determine the primary goals of your company and compile a list of your intended business results. And divide your business goals into quantifiable analytics targets.
2. Costing:
Before investing, it is crucial to comprehend the various pricing structures that different analytics systems have.
3. Interface:
It must be simple to use, allowing even non-technical people to build and comprehend dashboards and reports.
4. Integration:
You must choose between a standalone solution and an integrated solution when choosing your analytics tool for your company.
5. Advancement of Analytics:
It must produce contextualized insights and go beyond straightforward mathematical calculations so that you may construct sophisticated statistical models and secure the future of your company.
6. Customizable:
You must choose an analytics solution that satisfies your particular needs because every firm has different requirements.
7. Communication and collaboration:
To support more informed, team-based decision-making, your analytics platform must enable users to exchange, analyze, and engage with data in various content forms.
8. Security:
Establish standardized security controls and procedures at all levels, including the process, system, and data levels, to restrict which people or groups may access data.
These are the few most important factors to consider before choosing the correct AI Data Analytics for yourself or your company.