


Venmo is a popular peer-to-peer payment service owned by PayPal that lets users send and receive money from friends and family. Some transactions on Venmo, like credit card payments and instant transfers, may have fees.
One of Venmo’s signature features is its social feed where users can add comments and emojis to payments. It started as an SMS-only service but has expanded to offer more features over time.
Venmo was acquired by PayPal for $800 million in 2013 and is now estimated to be worth around $38 billion.
Company Overview
- Launch Date: Venmo was founded in the year 2009.
- HQ (Headquarters): Venmo’s headquarters are located in New York City, USA.
- People: Venmo employs various teams, including software engineers, product managers, and customer support staff, to facilitate its mobile payment service.
- Industry: Venmo is positioned within the financial technology (FinTech) industry, specifically focusing on mobile payments and digital wallet services.
Key Stats
- Venmo’s estimated annual revenue for 2023 is $2,400 million.
- The estimated annual payment volume for Venmo in 2023 is $298 billion.
- Venmo is estimated to have 85.1 million users in 2023.
- Female users constitute 53.76% of Venmo’s user base, while males make up 46.24%.
- The age group of 25 to 34 represents the largest segment of Venmo users at 26.24%, while those aged 65+ account for 7.47%.
- Venmo was valued at $38 billion in 2020.
- 83% of Americans are aware of Venmo, with 36% finding it popular and 31% actively using it.
- Venmo holds a 38% market share as the second most-used online payment method in the US, following PayPal at 81%.
- Among crypto wallet users, Venmo captures 18% of the market share.
- Venmo’s transaction volume in 2022 reached $245.3 billion, marking a 28.30% increase.
- Venmo is estimated to employ 793 people in 2023.
Venmo revenue
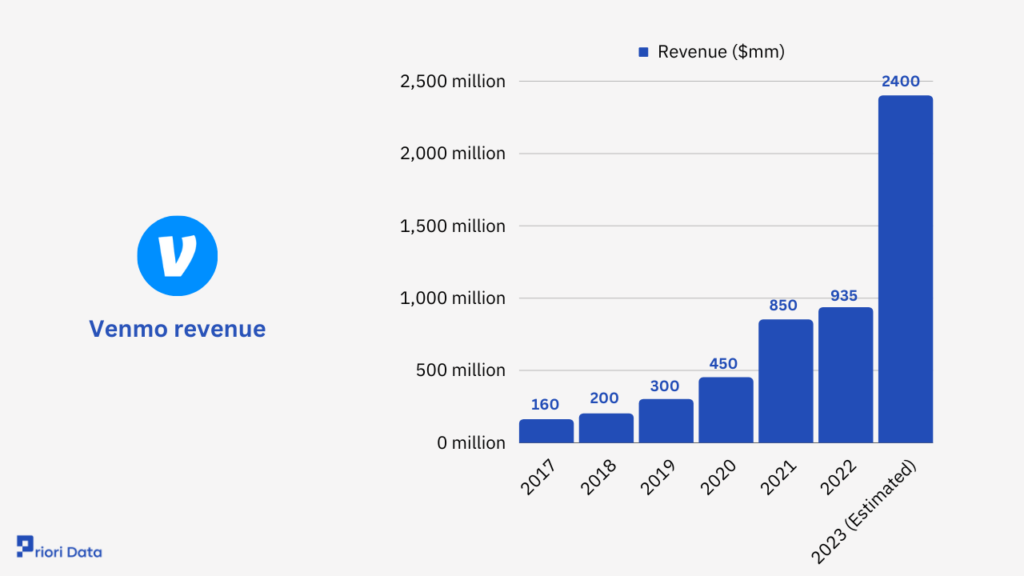
Venmo annual revenue 2017 to 2023 ($mm)
Venmo’s Revenue:
Venmo’s revenue has seen consistent growth over the years. Starting at $160 million in 2017, it had a substantial rise to $850 million by 2021. The revenue for 2022 was $935 million, and it’s projected to reach an impressive $2.4 billion in 2023.
| Year | Revenue ($mm) |
|---|---|
| 2017 | 160 million |
| 2018 | 200 million |
| 2019 | 300 million |
| 2020 | 450 million |
| 2021 | 850 million |
| 2022 | 935 million |
| 2023 (Estimated) | 2,400 million |
Sources: Company data, The Street
Venmo annual payment volume
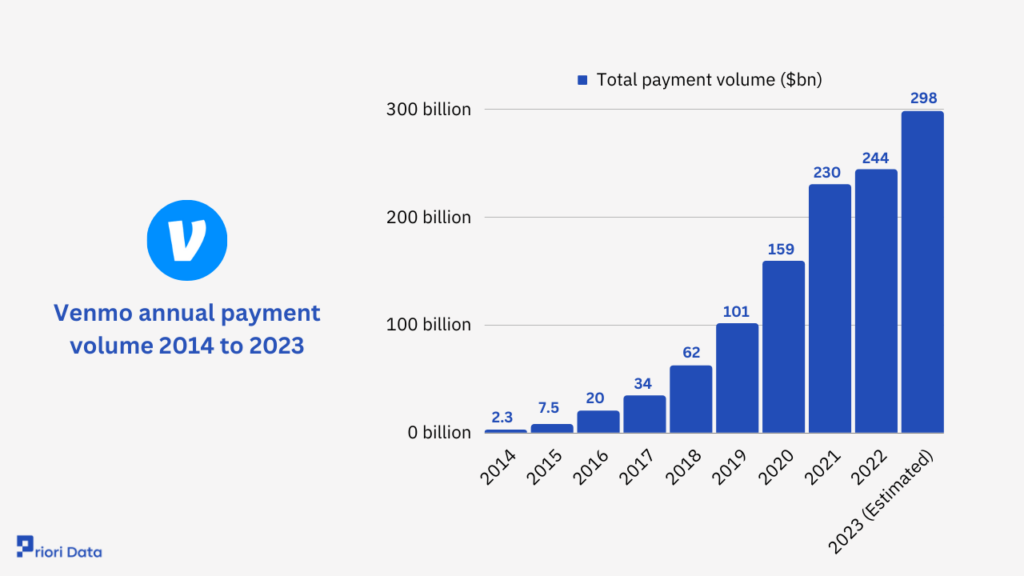
Annual Payment Volume:
Venmo’s payment volume has seen exponential growth since 2014. It grew from $2.3 billion in 2014 to $244 billion in 2022, an over 100-fold increase in 8 years.
The 2022 figure represents nearly a 50% jump from the previous year’s $159 billion. Looking ahead, volume is forecast to rise over 20% again in 2023, expected to reach $298 billion.
The tremendous growth illustrates Venmo’s rapid expansion as a platform for peer-to-peer financial transactions.
Venmo annual payment volume 2014 to 2023 ($bn)
| Year | Total payment volume ($bn) |
|---|---|
| 2014 | 2.3 billion |
| 2015 | 7.5 billion |
| 2016 | 20 billion |
| 2017 | 34 billion |
| 2018 | 62 billion |
| 2019 | 101 billion |
| 2020 | 159 billion |
| 2021 | 230 billion |
| 2022 | 244 billion |
| 2023 (Estimated) | 298 billion |
Venmo users
As a Venmo user, you have access to a hassle-free and user-friendly platform for managing your finances and dividing expenses with friends and family. With Venmo’s steady growth and reliability, you can count on it as your preferred tool for everyday financial transactions
Venmo annual users 2015 to 2023 (mm)
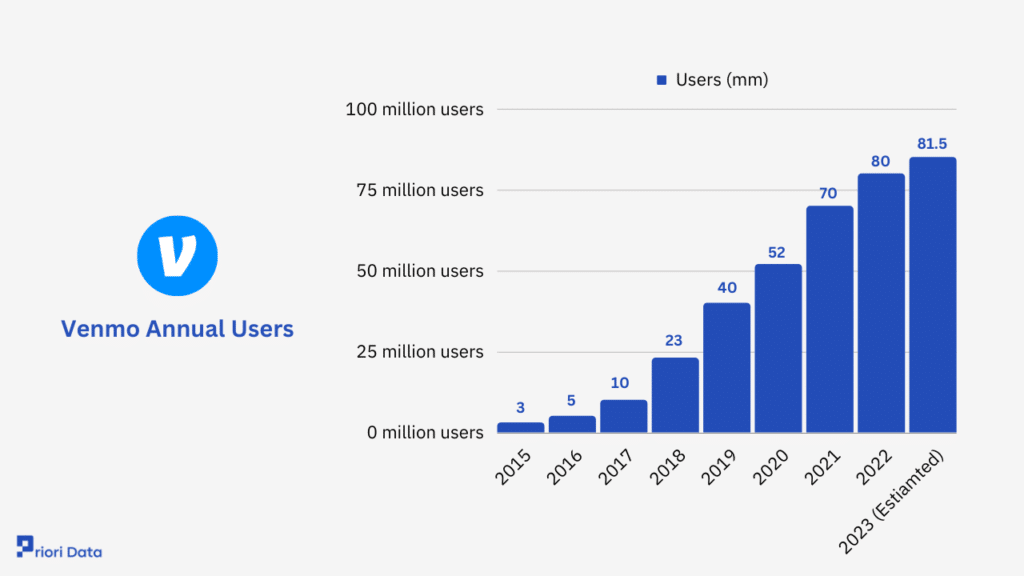
How many people use Venmo?
Over the past eight years, the growth trajectory of users on this platform has been nothing short of remarkable.
In 2015, the platform started with a modest 3 million users, which then doubled to 5 million in 2016.
The real turning point was in 2017 when the user base skyrocketed to 10 million users.
By 2020, the platform boasted an impressive 52 million users, and in 2021, it further expanded to 70 million users.
The growth trend remains consistent, with 80 million users in 2022 and an estimated 85.1 million users by 2023.
Venmo Annual Users:
| Year | Users (mm) |
|---|---|
| 2015 | 3 million users |
| 2016 | 5 million users |
| 2017 | 10 million users |
| 2018 | 23 million users |
| 2019 | 40 million users |
| 2020 | 52 million users |
| 2021 | 70 million users |
| 2022 | 80 million users |
| 2023 (Estiamted) | 85.1 million users |
Source: Fast Company, The Street, Paypal
Venmo Users by Gender
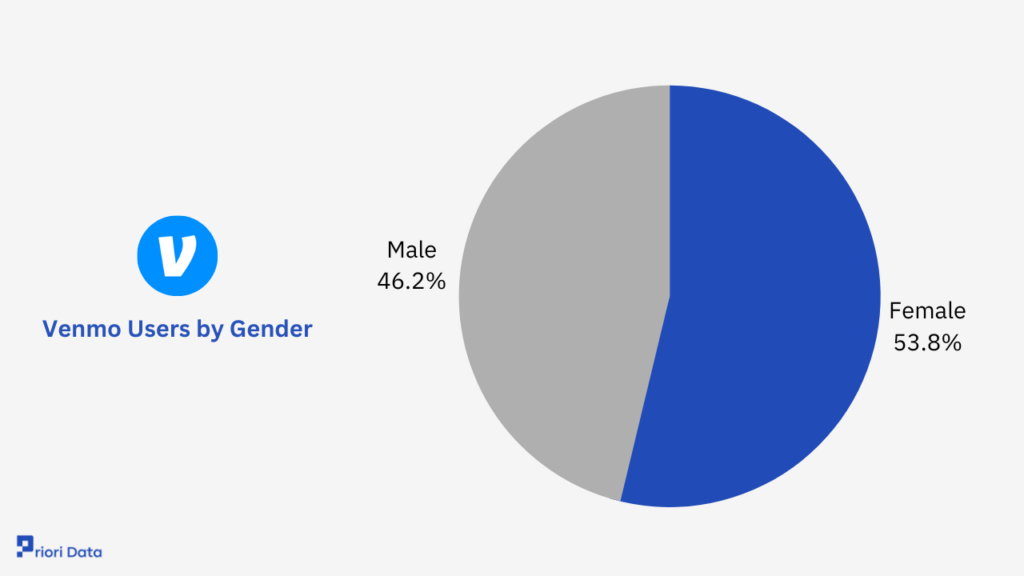
Approximately 53.76% of Venmo users are female, while 46.24% are male.
| Gender | Percentage |
|---|---|
| Female | 53.76% |
| Male | 46.24% |
Venmo Users by Age
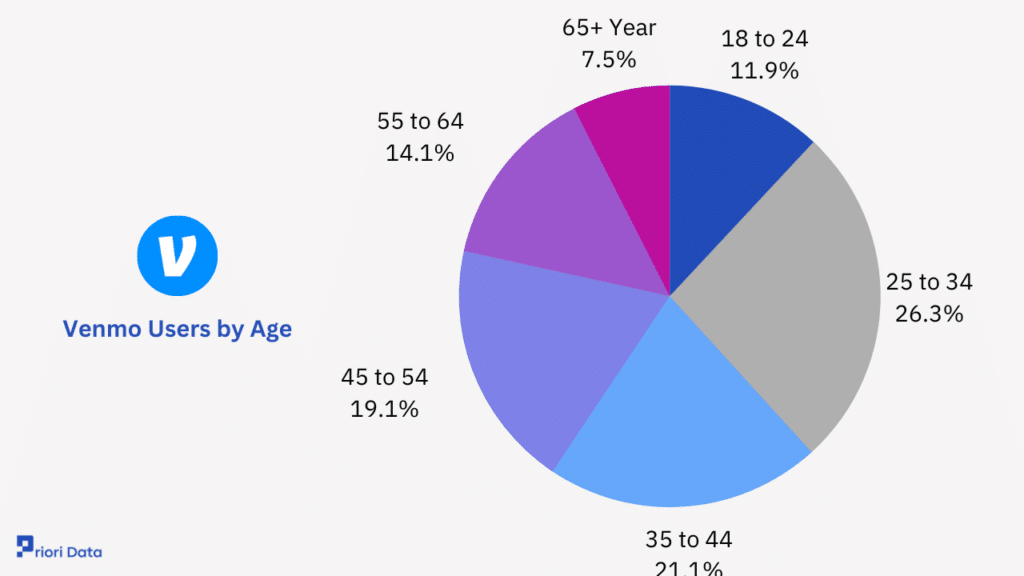
Venmo experiences its strongest user presence within the age bracket of 25 to 34, contributing a total of 26.24%.
Conversely, the age group least represented on the platform is individuals aged 65 and older, comprising 7.47% of users.
Venmo Users by Age:
| Age Group | Percentage |
|---|---|
| 18 to 24 | 11.91% |
| 25 to 34 | 26.24% |
| 35 to 44 | 21.07% |
| 45 to 54 | 19.01% |
| 55 to 64 | 14.02% |
| 65+ Year | 7.47% |
Venmo Users by Tipping Habits
Waiters and bartenders top the list with a staggering 91% of customers leaving tips, showcasing the strong cultural norm in the restaurant and hospitality industry.
Barbers, not far behind, have 83% of customers who appreciate their services with a tip, underlining the importance of grooming professionals in people’s lives.
In contrast, drivers receive tips from 50% of their passengers, indicating a more mixed tipping culture in the transportation sector.
Venmo Users by Tipping Habits:
| Tip by Profession | Percentage |
|---|---|
| Waiters & Bartenders | 91% |
| Barbers | 83% |
| Drivers | 50% |
Venmo Marketing Channels
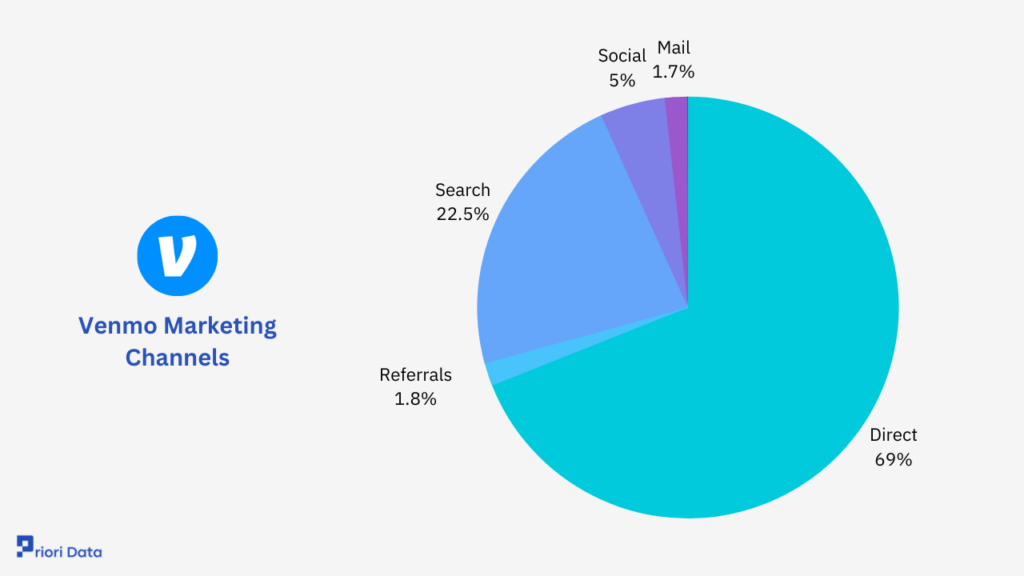
In terms of marketing channels for Venmo, the highest share of traffic comes from direct sources at 67.47%, while display channels contribute the lowest share at 0.06%.
| Marketing Channels | Traffic Share |
|---|---|
| Direct | 67.47% |
| Referrals | 1.72% |
| Search | 22.03% |
| Social | 4.88% |
| 1.67% | |
| Display | 0.06% |
Source: Similarweb
Venmo valuation
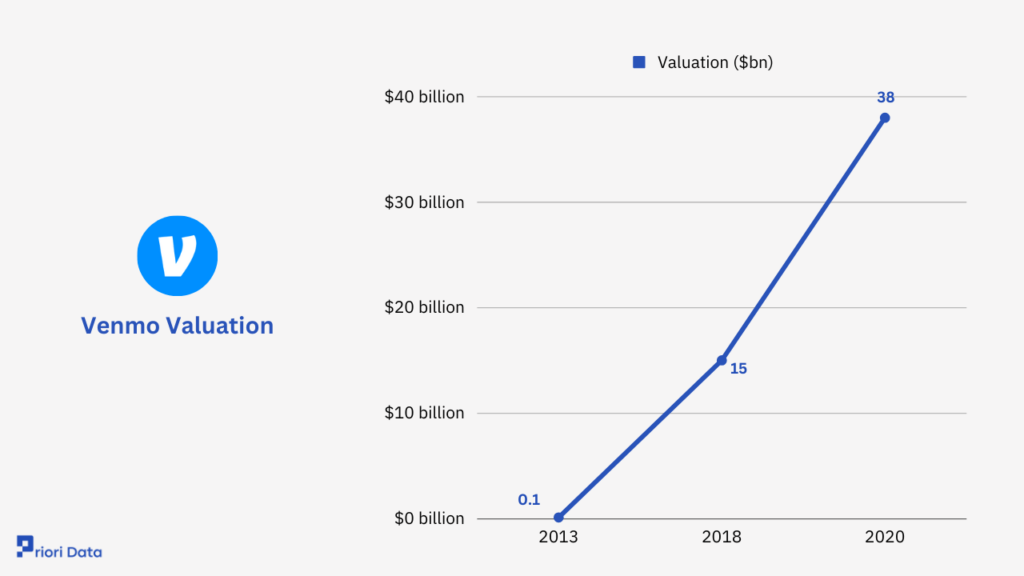
In 2020, Venmo received an independent valuation of $38 billion.
Venmo valuation 2015 to 2023 ($mm)
| Year | Valuation ($bn) |
|---|---|
| 2013 | $0.1 billion |
| 2018 | $15 billion |
| 2020 | $38 billion |
Sources: Crunchbase
Venmo Funding
In December 2009, Venmo initiated its journey with a debt financing round, raising $100,000 to kickstart its operations.
The next significant milestone was in May 2010, when it secured $1.2 million in a seed round from nine investors, demonstrating early investor confidence.
Finally, on August 1, 2011, it entered the Series-A funding round, with four investors participating, although the specific funds raised for this round are undisclosed.
This chronology showcases the company’s ability to attract investments at various stages of its development, reflecting its growth and potential in the market.
| Funding Date | Round Name | Investors | Funds Raised |
|---|---|---|---|
| Aug 1, 2011 | Series – A | 4 | |
| May 7, 2010 | Seed Round | 9 | $1.2 mn |
| Dec 14, 2009 | Debt Financing | $100,000 |
Venmo’s market position in the US
Venmo occupies a significant market position in the United States, with several key characteristics highlighting its influence.
First and foremost, a remarkable 83% of the population is aware of Venmo, indicating its widespread recognition.
While awareness is high, popularity stands at 36%, suggesting that a substantial portion of those who are aware of Venmo also find it popular and appealing.
In terms of usage, 31% of the population actively utilizes Venmo for their financial transactions, demonstrating its practicality and adoption among users.
Additionally, Venmo enjoys a notable level of loyalty, with 27% of its user base consistently choosing the platform for their payment needs.
Lastly, buzz, which measures the level of discussion and excitement surrounding Venmo, stands at 29%, reflecting a healthy level of interest and engagement among users and the broader public.
Venmo’s market position in the US
| Characteristic | Response |
|---|---|
| Awareness | 83% |
| Popularity | 36% |
| Usage | 31% |
| Loyalty | 27% |
| Buzz | 29% |
Source: Statista
PayPal emerges as the dominant choice, with a substantial 81% adoption rate. Venmo, owned by PayPal, is the 2nd most used payment method with a significant share of 38%.
Apple Pay, Google Pay, and Amazon Pay follow closely, with adoption rates of 34%, 31%, and 30%, respectively.
Meanwhile, Meta Pay (formerly Facebook) stands at 12%, while Mastercard Click to Pay (Masterpass) and Skrill have adoption rates of 9% and 4%, respectively.
The remaining 10% falls into the “Other” category, which encompasses a range of lesser-known or niche payment methods.
Venmo market share
| Payment Methods | Percentages |
|---|---|
| PayPal | 81% |
| Venmo | 38% |
| Apple Pay | 34% |
| Google Pay | 31% |
| Amazon Pay | 30% |
| Afterpay | 17% |
| Visa Checkout | 16% |
| Klarna | 14% |
| Meta Pay (Facebook) | 12% |
| Mastercard Click to Pay (Masterpass) | 9% |
| Skrill | 4% |
| Other | 10% |
Source: Statista
Venmo Crypto Wallet Users
The distribution of crypto wallet users among various platforms reveals an interesting landscape.
PayPal leads the pack with a 21% share of users, followed closely by Coinbase at 20%. Venmo, the very platform under scrutiny, commands an 18% share, indicating a notable presence in the crypto wallet market
Cash App holds a respectable 12% share, while Binance, a prominent cryptocurrency exchange, captures 10% of the user base.
The remaining 19% is attributed to other platforms in this competitive ecosystem.
This data illustrates the diverse choices available to users in the crypto wallet arena, with each platform carving out a significant niche.
It also highlights Venmo’s noteworthy position as a player in the cryptocurrency wallet space, contributing to the overall diversity of options for users.
Venmo Crypto Wallet Users
| Wallet | Percentage Share |
|---|---|
| Paypal | 21% |
| Coinbase | 20% |
| Venmo | 18% |
| Cash App | 12% |
| Binance | 10% |
| Others | 19% |
Venmo Transaction volume
In 2017, Venmo recorded $34.2 billion in transactions. The following years saw substantial percentage increases, with 2018 experiencing a remarkable 323.10% growth, reaching $62 billion.
In 2021, the growth was even more remarkable, with transactions totaling $229.6 billion, an increase of 186.60% from the previous year.
The latest available data from 2022 shows a transaction volume of $245.3 billion, marking a 28.30% increase compared to 2021.
| Year | Transactions | Percentage Change |
|---|---|---|
| 2022 | $245.3 billion | 28.30% |
| 2021 | $229.6 billion | 186.60% |
| 2020 | $159 billion | 226.90% |
| 2019 | $101 billion | 257.80% |
| 2018 | $62 billion | 323.10% |
| 2017 | $34.2 billion | – |
Source: Statista
Venmo’s Social Media Trafic Distribution
Among the various platforms, Facebook leads the pack with a substantial 33.90% share of Venmo’s social media traffic, indicating a significant presence and engagement on this platform.
Following closely is YouTube, accounting for 21.18% of the traffic, highlighting the importance of visual content and video engagement for Venmo users.
Instagram and Twitter also play notable roles, with shares of 16.00% and 12.30%, respectively. These platforms seem to attract users seeking a more visual and real-time interaction with Venmo.
Reddit captures 8.00% of the social media traffic, indicating an active presence in online communities and forums where discussions and recommendations about Venmo may be taking place.
| Social Media | Share |
|---|---|
| 33.90% | |
| Youtube | 21.18% |
| 16.00% | |
| 12.30% | |
| 8.00% | |
| Others | 8.01% |
Venmo Employee Headcount
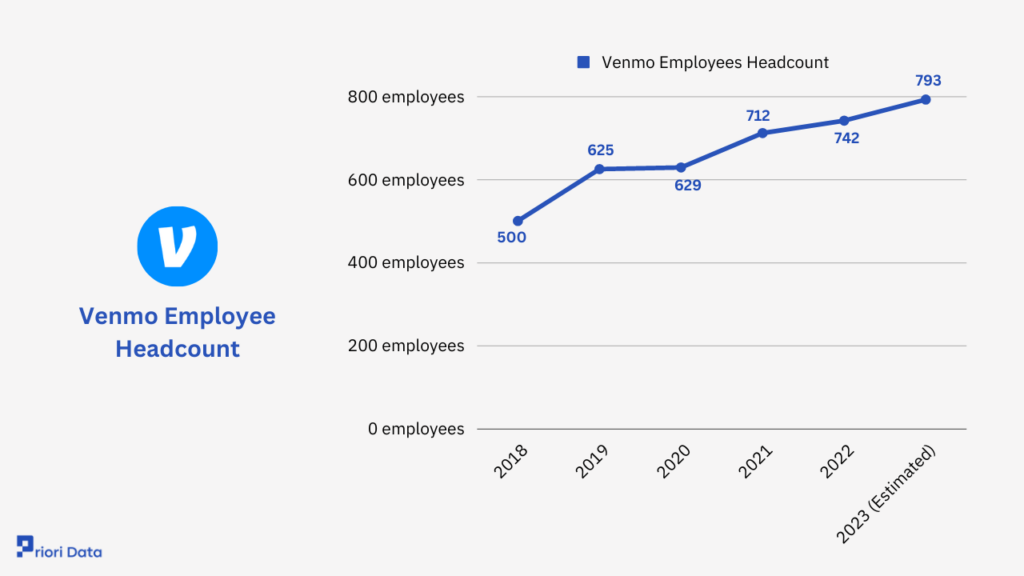
Venmo’s employee headcount has experienced substantial growth over the past few years, reflecting the platform’s expansion and development.
In 2018, the company had 500 employees, and this number steadily increased to 625 employees in 2019.
The growth trend continued in 2020, with a headcount of 629 employees, and accelerated significantly in 2021, reaching 712 employees.
Notably, in 2022, the company saw a considerable uptick to 742 employees, and the growth trajectory is expected to persist, with an estimated 793 employees projected for 2023.
This data highlights Venmo’s commitment to its workforce as it scales up operations, ensuring it has the talent and resources necessary to support its growing user base and evolving services.
| Year | Venmo Employees Headcount |
|---|---|
| 2023 (Estimated) | 793 employess |
| 2022 | 742 employees |
| 2021 | 712 employees |
| 2020 | 629 employees |
| 2019 | 625 employees |
| 2018 | 500 employees |
Sources: Company data, LinkedIn
Other Stats
- Venmo Shopping Habits: A significant 92% of Venmo users have engaged in online shopping within the last six months.
- Preferred Purchases: About 56% of Venmo’s user base primarily utilizes the platform for purchasing clothing, footwear, or accessories.
- Adoption Across Sectors: Notably, Venmo sees active utilization in the education sector with 113 million users, and the advertising sector with 58 million users.
- Tipping Trends: An impressive 93% of Venmo customers have reported leaving a tip in the past six months.
- Deferred Payments: Venmo could draw in 22% more users if it offered the option to pay for purchases over an extended period.
- Emoji Usage: In the realm of using emojis for financial transactions, both men and women commonly employ pizza slice and money stack with wings emojis.
- Milestone Achievement: In January 2016, Venmo surpassed the milestone of processing over $1 billion in monthly payment volume.
- Widespread Merchant Acceptance: Over 2 million merchants across the United States are now equipped to accept Venmo as a mobile payment method.
- QR Code Integration: The QR Code feature within Venmo is actively embraced by 65% of its user base.
- Business Engagement: Venmo’s “Pay With Venmo” feature has found traction among more than 9,000 businesses and 2 million sellers.