


Launched in 2012 in Hatch Labs, Tinder has become a popular dating app. It was designed by Justin Mateen and Sean Rad to offer better match-making algorithm results to people.
The app simply matches one user to another based on their geographical locations. After registering themselves with the app, users need to swipe the profiles of others. Swipe right is like while the left is pass. When users swipe each other right, they can chat through the app.
Initially, Tinder was tested in a series of colleges in the USA. After great success, the app became available to people. By late 2013, Tinder processed 350 million swipes, roughly 4,000 per second. In just one year, it increased to 1 billion swipes per day.
As of 2022, Tinder is known to have 10.9 million subscribers, making it one of the most popular dating apps.
Read on to know the data and statistics of Tinder.

Tinder Key Statistics
Tinder eliminates the hassle of complex algorithms used by other mobile dating apps. It has made dating easy by reducing everything to the simplest level one finds in real life.
While Tinder is known as a hook-up app, people use it for dating. In 2015, the app introduced a subscription-based model (Tinder Plus) with better features and services. Later in 2017, the app got one more paid model, Tinder Gold.
Over the years, Tinder has become a giant in the world of dating. Even with new competition, Tinder remains to be the most used app.
Here are quick Tinder key statistics:
- As of 2022, Tinder has made 1.79 billion in revenue, a 9% increase from the previous year.
- By September 2022, Tinder’s in-app purchase revenue worldwide was $76.49 million, with North and Latin America having the highest share.
- Tinder’s annual active subscribers in 2022 were 10.9 million.
- Most Tinder users are 35 years and younger.
- More than half of Tinder’s users are male.
Tinder Overview
- Launch Date: 12 September 2012
- Headquarters: Los Angeles, California
- People: Renate Nyborg and Shar Dubey
- Business Type: Subsidiary
- Owner: Match Group
- Industry: Online Dating
Tinder Revenue
After Match Group launched Tinder as a public app, it generated more revenue. The app’s direct revenue in 2022 was $1.79 billion.
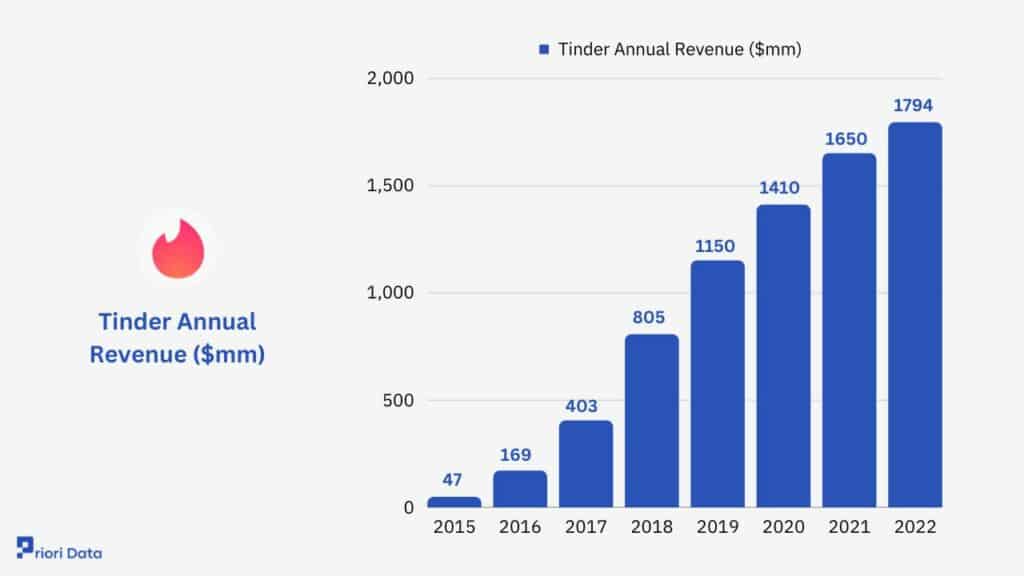
Tinder Annual Revenue ($mm)
| Year | Revenue ($mm) |
| 2015 | 47 |
| 2016 | 169 |
| 2017 | 403 |
| 2018 | 805 |
| 2019 | 1150 |
| 2020 | 1410 |
| 2021 | 1650 |
| 2022 | 1794 |
Tinder Subscribers
The number of Tinder’s paying subscribers reached 10.9 million in 2022, a 10% year-on-year increase.
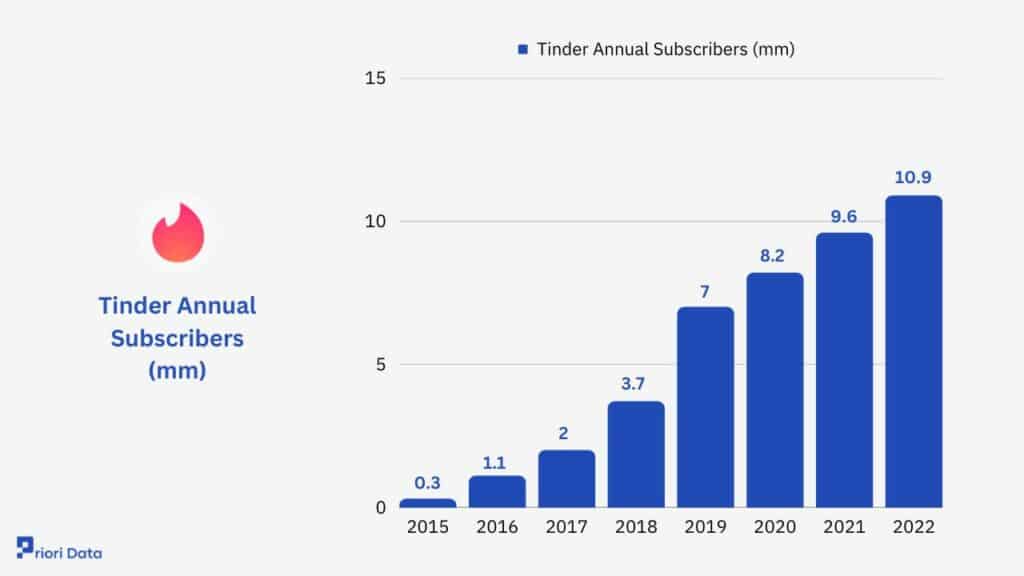
Tinder Annual Subscribers (mm)
| Year | Subscribers (mm) |
| 2015 | 0.3 |
| 2016 | 1.1 |
| 2017 | 2 |
| 2018 | 3.7 |
| 2019 | 7 |
| 2020 | 8.2 |
| 2021 | 9.6 |
| 2022 | 10.9 |
Tinder User Penetration
Of all the dating apps, Tinder has the highest user penetration rate. Most users are between 18.24 years.
By 2023, the number of Tinder users in the USA is forecasted to be 25.7 million. Currently, the app offers nine sexual orientations to users.
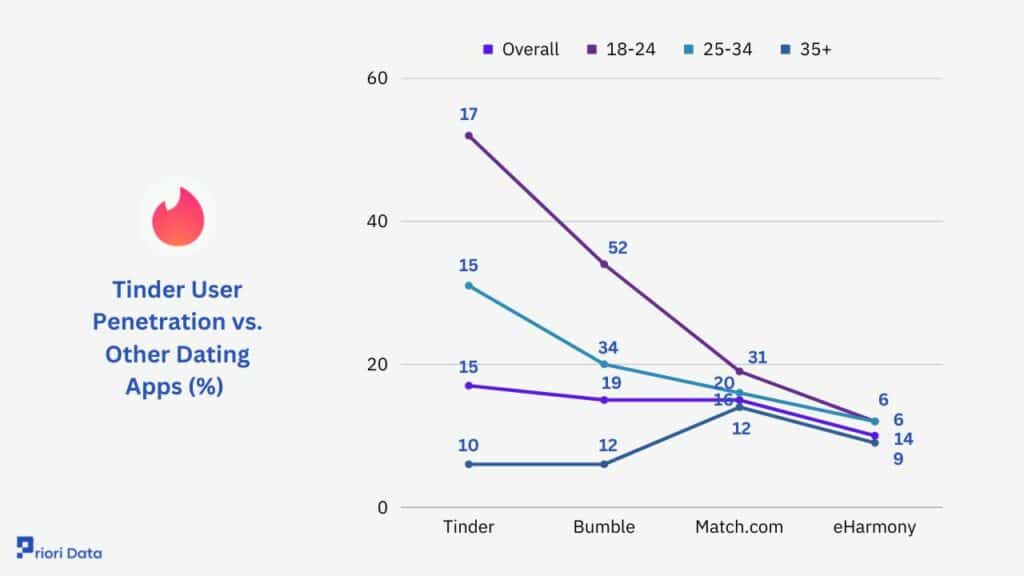
Tinder User Penetration vs. Other Dating Apps (%)
| App | Overall | 18-24 | 25-34 | 35+ |
| Tinder | 17 | 52 | 31 | 6 |
| Bumble | 15 | 34 | 20 | 6 |
| Match.com | 15 | 19 | 16 | 14 |
| eHarmony | 10 | 12 | 12 | 9 |
Tinder Age Demographics
Being the first dating app to introduce a swipe-and-match interface, Tinder soon became popular among people. It emerged as a game-changer in the online dating sector. Plus, the simplicity of Tider helped it become the fastest dating startup.
But with so much popularity of this dating platform, which age group uses it the most? The primary Tinder users are under 25 years. Lately, the app has become popular with older group people as well.
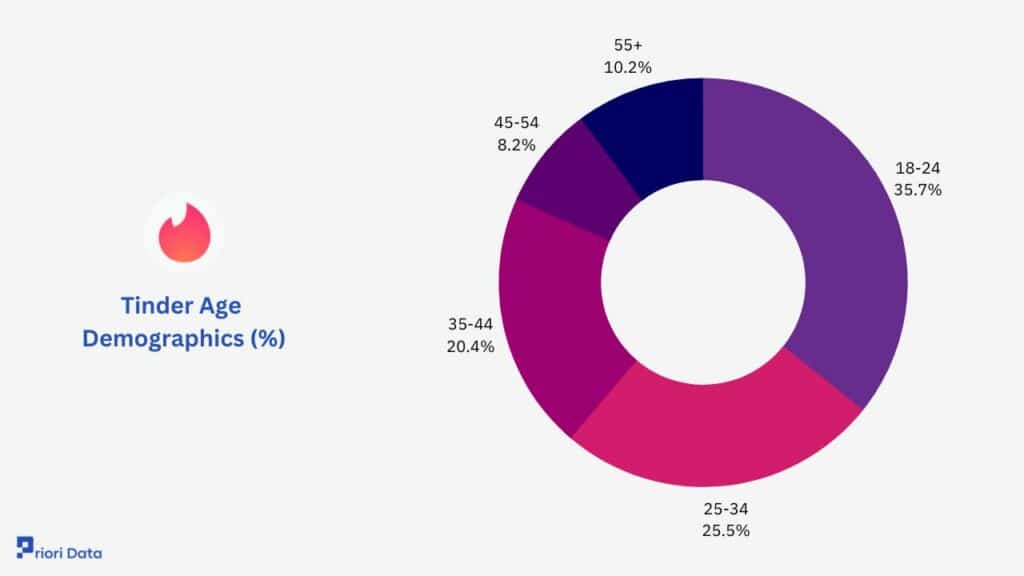
Tinder Age Demographics (%)
| Age | Percentage of Users (%) |
| 18-24 | 35 |
| 25-34 | 25 |
| 35-44 | 20 |
| 45-54 | 8 |
| 55+ | 10 |
Tinder Gender Demographics
When it comes to gender demographics, Tinder seems to have a great imbalance.
On average, Tinder has 75% male, but the number of male users in countries like India is even more. In contrast, Europe has a balance of 50/50 users.
Tinder Gender Demographics (%)
| Age | Percentage of Users |
| Female | 24 |
| Male | 75 |
Tinder’s gender ratio cannot be trusted entirely because the app has other gender options. But even if you identify yourself as non-binary, the app is likely to categorize you as male or female.
Tinder Income Demographics
Tinder users do not come from the same income brackets. The highest number of users falls in the $60-80k household income bracket.
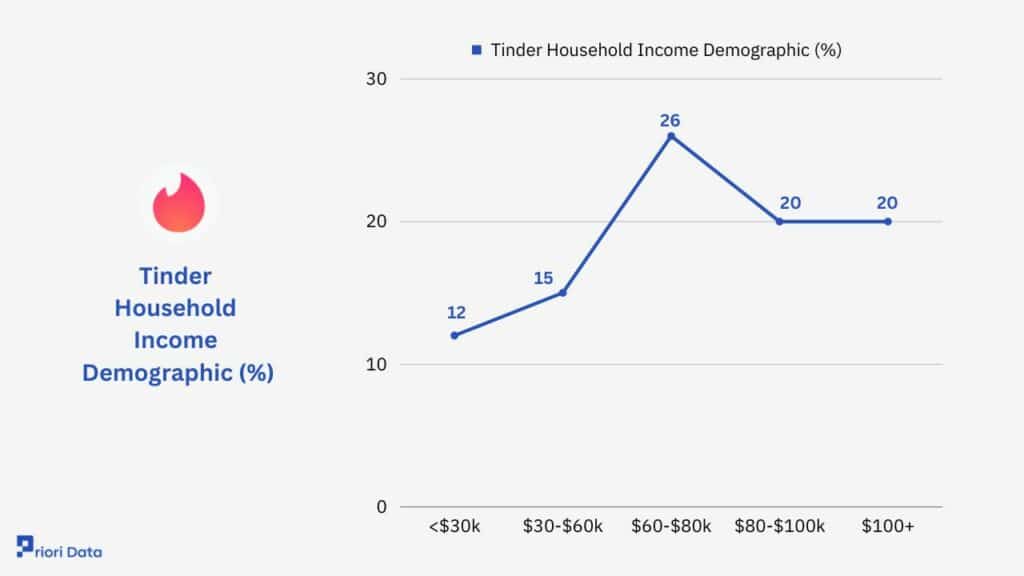
Tinder Household Income Demographic (%)
| HH Income | Percentage of Users |
| <$30k | 12 |
| $30-$60k | 15 |
| $60-$80k | 26 |
| $80-$100k | 20 |
| $100+ | 20 |
Tinder Marriage Statistics
Tinder has an image of being a hookup app. But many people have used this app to find their partner. Scroll down to check Tinder marriage statistics.
As of 2022, Tinder was responsible for 27% of marriages. The app is also used by people who have had a breakup or divorce.
Tinder FAQ
Ques 1: What number of people use Tinder once a month?
Ans: Tinder has 75 million active users, among which 7.8 million are from the USA.
Ques 2: How much of Match Group’s revenue comes from Tinder?
Ans: Tinder is reported to contribute about 59% of the total Match Group’s revenue.
Ques 3: Which country has the most Tinder users?
Ans: The USA has the largest number of Tinder users, followed by the UK.
Ques 4: How many times have people downloaded Tinder?
Ans: Tinder is reported to be downloaded more than 400 million times.
Ques 5: In how many countries Tinder offers its services?
Ans: Tinder is available in 190 countries and 40 different languages.
Ques 6: In a week, how many Tinder users go on dates?
Ans: About 1.5 million Tinder users are reported to go on dates per week.
Ques 7: How many times does an active user use Tinder?
Ans: On average, an active user uses Tinder four times a day.