
Google Play is the biggest app store in the world. It has the most apps available for download and the most users.
Google Play started in 2008 under the name Android Market, a few months after Apple launched its App Store.
At first, the Android Market had fewer apps than the App Store. But by 2011, it surpassed the App Store.
An important moment came in 2012 when Google rebranded many of the Android apps as Google Play. This marked the birth of the Play Store.
Over the next 5 years, developers made about 2 million apps & games for the Google Play Store.
The year 2017 witnessed a peak of 3.6 million applications. That same year, Google started removing older apps that didn’t work with the newest Android operating system updates.
Google also began enforcing stricter rules for new developers wanting to put apps in the Play Store. Because of this, over 1 million apps were removed.
Even though the Google Play Store has many more users, the Apple App Store still makes more money from consumer spending. Google Play spending has almost doubled since 2018, but it still trails behind Apple.
As part of agreements with Google, manufacturers have to include these apps. Along with limits on third-party app stores, this effectively restricts competition from other app stores.
Some manufacturers like Samsung and HTC tried to launch their own third-party app stores in the 2010s, but they couldn’t reach many Android users outside their own customers.
Key stats:
- According to Google Play Store analytics, there are a total of 20 million paying subscribers, including both YouTube Music and Google Play.
- Around 49% of gamers on Google Play Games are women, highlighting gender diversity in gaming.
- Daily safety scans on Google Play cover nearly 6 billion apps, ensuring user security.
- Google Play Store has successfully expanded its reach to 190 countries, showcasing its enduring success.
- The Google Play Store features an extensive collection of 40 million songs.
- In the year 2022, Candy Crush Saga held the distinction of being the most downloaded game on Google Play.
- Google took action by removing nearly 700,000 outdated apps from the Play Store.
- In 2022, consumers invested a substantial $42.3 billion in Google Play games & apps.
- Google Play witnessed an impressive 110 billion downloads of apps & games throughout the year.
- Google Play offers a vast selection with a whopping 2.65 billion apps & games available for download.
- The highest-grossing app on Google Play in 2022 turned out to be Google One.
- TikTok emerged as the most downloaded app for the year 2022 on Play Store, with a remarkable 460 million downloads.
Annual Google Play revenue (apps & games)
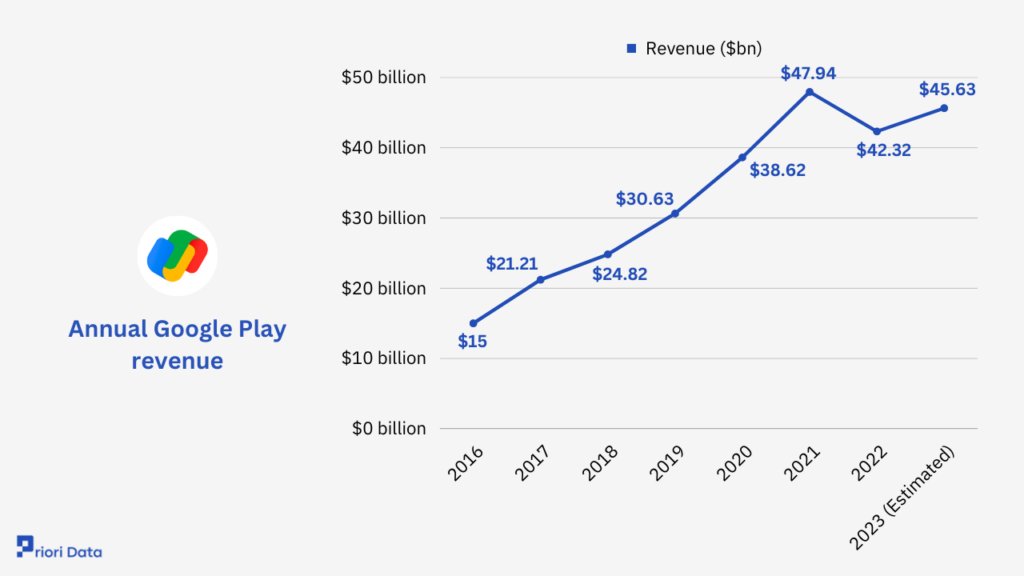
The annual revenue generated by Google Play apps & games has witnessed steady growth over the years.
In 2016, the revenue stood at $15 billion, and it showed significant progress in the following years. By 2017, it had climbed to $21.21 billion, further increasing to $24.82 billion in 2018.
The upward trajectory continued, reaching $47.94 billion in 2021, demonstrating the platform’s robust financial performance.
While there was a slight dip in 2022, with revenue totaling $42.32 billion, it is estimated to rebound in 2023 to reach $45.63 billion.
Annual Google Play apps & game revenue 2023 :
| Year | Revenue ($bn) |
|---|---|
| 2016 | $15 billion |
| 2017 | $21.21 billion |
| 2018 | $24.82 billion |
| 2019 | $30.63 billion |
| 2020 | $38.62 billion |
| 2021 | $47.94 billion |
| 2022 | $42.32 billion |
| 2023 (Estimated) | $45.63 billion |
Sources:
Google Play app revenue for gaming
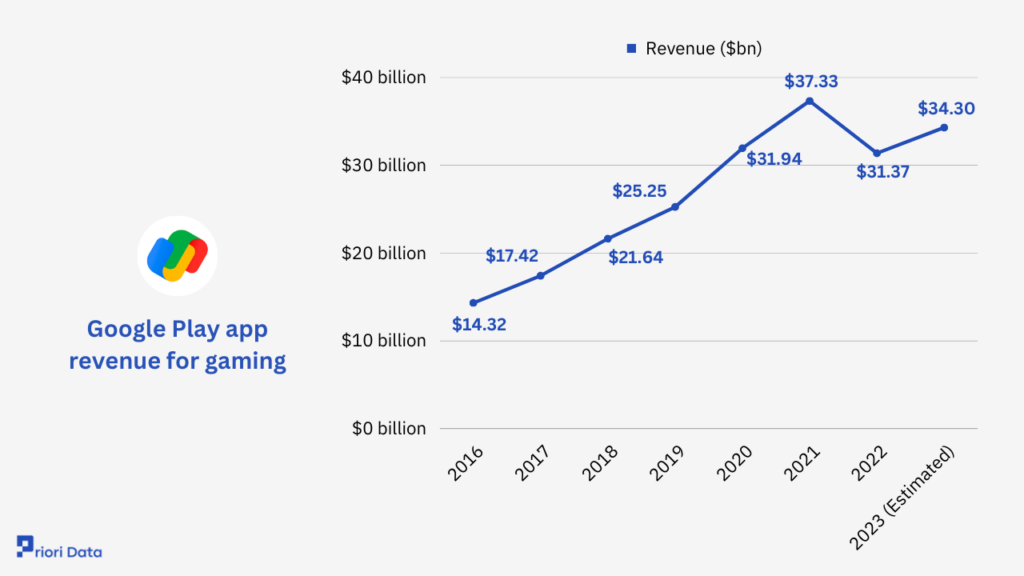
In 2016, the revenue stood at $14.32 billion, which marked the beginning of a steady upward trajectory. This trend continued with revenues reaching $31.94 billion in 2020, emphasizing the gaming industry’s resilience and popularity on the platform.
This surge in gaming engagement was largely attributed to the global pandemic. This momentum was carried into 2021, with revenue peaking at $37.33 billion.
However, 2022 saw a dip in revenue to $31.37 billion, possibly reflecting changes in user preferences or market dynamics.
Looking ahead, the estimated revenue for 2023 is $34.30 billion, suggesting a stabilizing trend and continued profitability in the Google Play gaming ecosystem.
Annual Google Play revenue for games 2023:
| Year | Revenue ($bn) |
|---|---|
| 2016 | $14.32 billion |
| 2017 | $17.42 billion |
| 2018 | $21.64 billion |
| 2019 | $25.25 billion |
| 2020 | $31.94 billion |
| 2021 | $37.33 billion |
| 2022 | $31.37 billion |
| 2023 (Estimated) | $34.30 billion |
Sources:
Google Play app revenue excluding Games
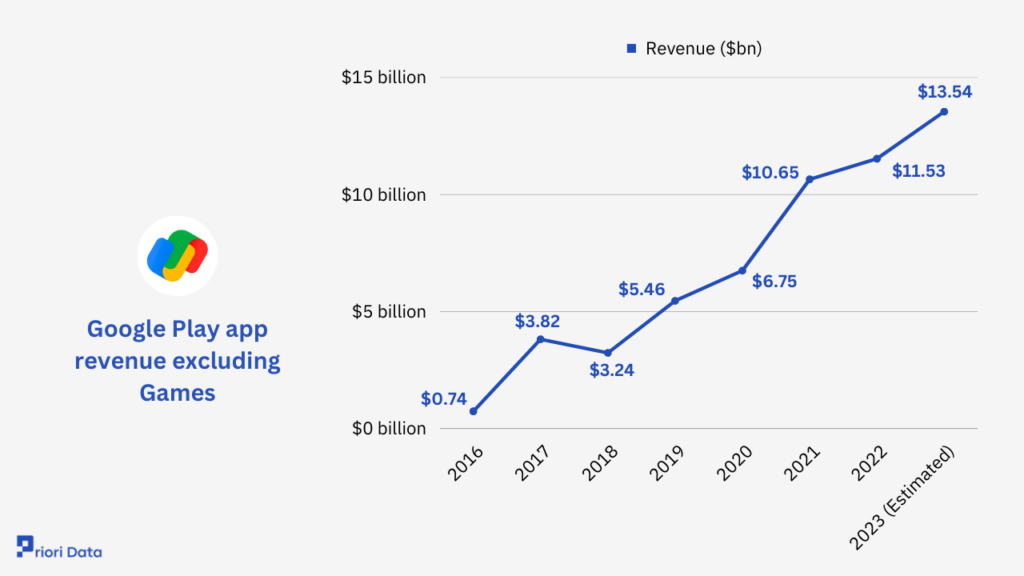
The annual app revenue on Google Play has displayed a consistent upward trajectory over the years, reflecting the platform’s sustained growth.
In 2016, it generated $0.74 billion in revenue, which more than quadrupled to $3.82 billion in 2017.
While there was a slight dip in 2018 to $3.24 billion, it swiftly rebounded in 2019, reaching $5.46 billion.
The upward trend continued with $6.75 billion in 2020 and a significant leap to $10.65 billion in 2021, showcasing the platform’s increasing popularity among users and developers.
Looking ahead, the revenue for 2022 stands at $11.53 billion, with further growth anticipated in 2023, projected at $13.54 billion.
Annual Google Play app revenue 2016 to 2023 (excluding games)
| Year | Revenue ($bn) |
|---|---|
| 2016 | $0.74 billion |
| 2017 | $3.82 billion |
| 2018 | $3.24 billion |
| 2019 | $5.46 billion |
| 2020 | $6.75 billion |
| 2021 | $10.65 billion |
| 2022 | $11.53 billion |
| 2023 (Estimated) | $13.54 billion |
Sources: Sensor Tower
Google Play app revenue for subscription
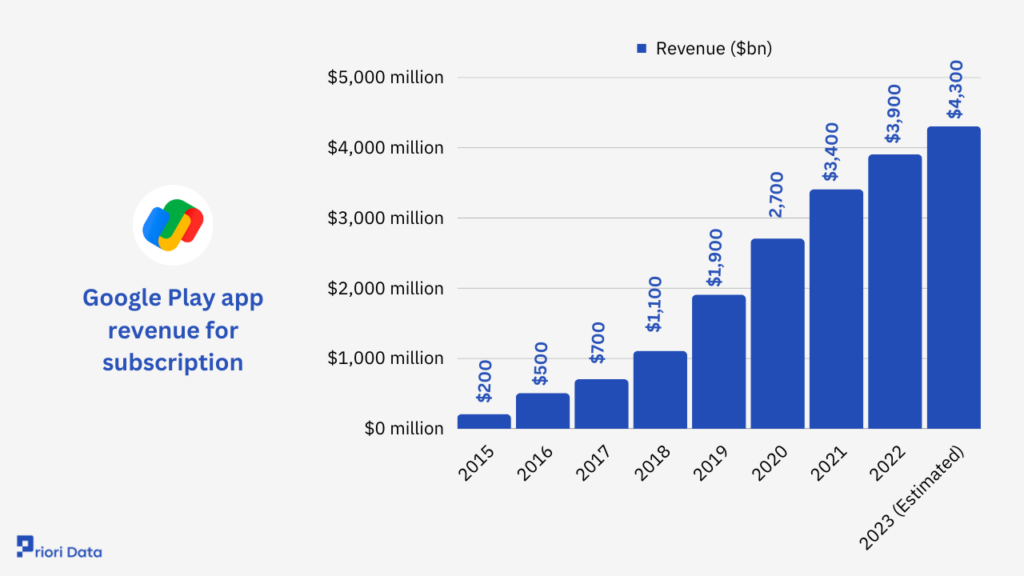
The annual revenue generated by subscription apps on Google Play has seen substantial growth from 2016 to the projected figures for 2023.
In 2016, it started at $0.5 billion and steadily increased each year. By 2017, it had already reached $0.7 billion, and this trend continued with revenue climbing to $1.9 billion in 2019.
The growth rate accelerated further in 2021, with revenue surging to $2.7 billion. The year 2022 saw continued robust growth, with revenue reaching $3.9 billion, and it is estimated to climb to $4.3 billion in 2023.
Annual Google Play app revenue for subscription 2016 to 2023:
| Date | Revenue ($bn) |
|---|---|
| 2015 | $200 million |
| 2016 | $500 million |
| 2017 | $700 million |
| 2018 | $1,100 million |
| 2019 | $1,900 million |
| 2020 | $2,700 million |
| 2021 | $3,400 million |
| 2022 | $3,900 million |
| 2023 (Estimated) | $4,300 million |
Source: Sensor Tower
Google Play app & game downloads
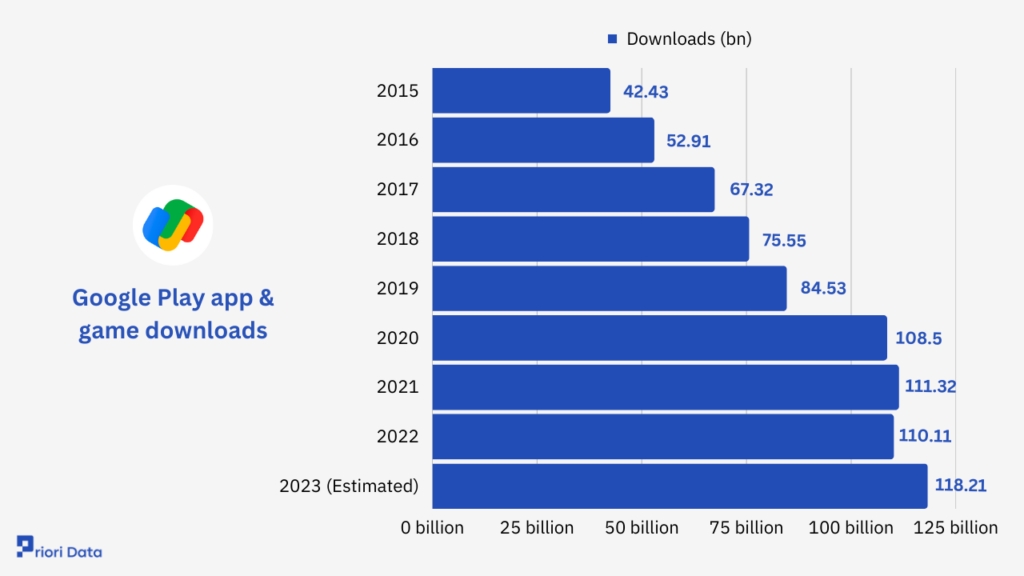
Over the past eight years, the Google Play platform has witnessed a remarkable increase in app & game downloads.
In 2015, it started with 42.43 billion downloads, and this number surged to 52.91 billion in 2016. The upward trajectory continued with 84.53 billion downloads in 2010 and 108.5 billion in 2020.
This trend persisted in 2021 with 111.32 billion downloads, remaining steady at 110.11 billion in 2022.
Looking ahead, the estimated projection for 2023 is an impressive 118.21 billion downloads.
These figures clearly indicate Google Play’s dominant position in the app & game distribution market, attracting users worldwide.
Annual Google Play app & game downloads 2015 to 2023:
| Year | Downloads (bn) |
|---|---|
| 2015 | 42.43 billion |
| 2016 | 52.91 billion |
| 2017 | 67.32 billion |
| 2018 | 75.55 billion |
| 2019 | 84.53 billion |
| 2020 | 108.5 billion |
| 2021 | 111.32 billion |
| 2022 | 110.11 billion |
| 2023 (Estimated) | 118.21 billion |
Google Play game downloads
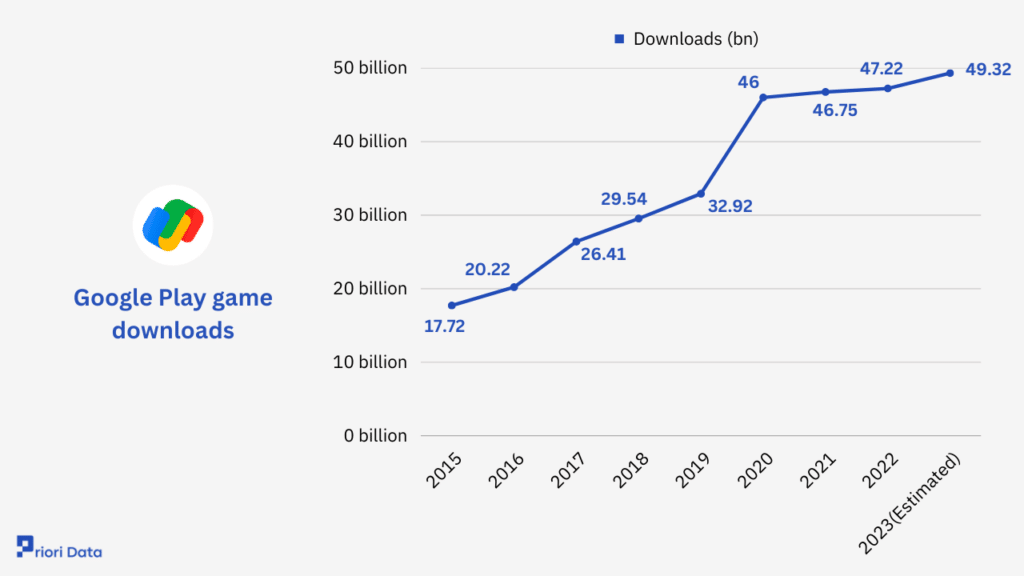
In 2015, Google Play started with 17.7 billion downloads and saw a steady rise, reaching 20.2 billion downloads in 2016. The momentum continued with significant increases each year, hitting 26.4 billion in 2017 and 29.5 billion in 2018.
The upward trajectory persisted in 2021, reaching 46.7 billion downloads. However, the year 2022 saw a slight increase to only 47.2 billion downloads.
Looking ahead to 2023, it’s estimated to climb even further to 49.3 billion downloads.
Annual Google Play game downloads 2015 to 2023:
| Year | Downloads (bn) |
|---|---|
| 2015 | 17.72 billion |
| 2016 | 20.22 billion |
| 2017 | 26.41 billion |
| 2018 | 29.54 billion |
| 2019 | 32.92 billion |
| 2020 | 46 billion |
| 2021 | 46.75 billion |
| 2022 | 47.22 billion |
| 2023(Estimated) | 49.32 billion |
Google Play app downloads
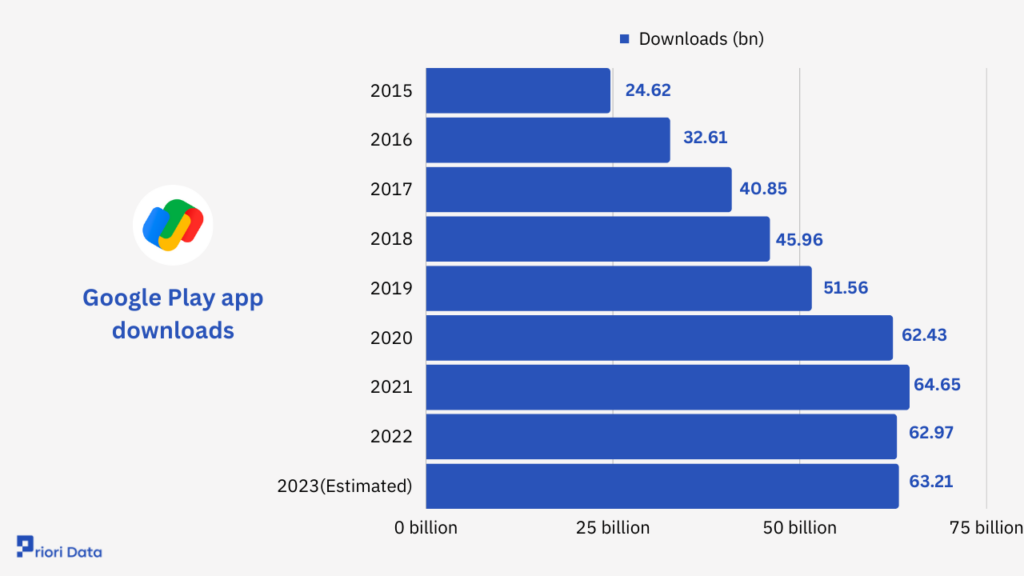
In 2015, the platform recorded 24.6 billion downloads, a number that continued to rise each year. By 2016, it had surged to 32.6 billion downloads, showing exponential growth.
The momentum continued in 2018, with 45.9 billion downloads, and 2019 saw another notable increase to 51.5 billion downloads.
This upward trajectory continued till 2021, with 64.6 billion downloads, and the momentum, broke in the year 2022 when a slight dip to 62.9 billion downloads was recorded.
Based on the above figures, Google Play is estimated to have 63.2 billion app downloads in the year 2023.
Annual Google Play app downloads 2015 to 2023:
| Year | Downloads (bn) |
|---|---|
| 2015 | 24.62 billion |
| 2016 | 32.61 billion |
| 2017 | 40.85 billion |
| 2018 | 45.96 billion |
| 2019 | 51.56 billion |
| 2020 | 62.43 billion |
| 2021 | 64.65 billion |
| 2022 | 62.97 billion |
| 2023(Estimated) | 63.21 billion |
Google Play app download distribution

The distribution of apps on Google Play based on the number of downloads reveals an interesting pattern.
A significant portion, 25.6% of apps, fall under the category of having under 100 downloads, showcasing the diversity and abundance of apps available on the platform.
Surprisingly, a considerable 28.2% of apps have garnered more than 100 downloads, indicating a fair number of apps with moderate popularity.
Moving up the ladder, 24.2% of apps have exceeded 1,000 downloads, demonstrating a substantial user base.
However, the competition intensifies in the higher tiers, with 13.9% of apps surpassing 10,000 downloads, 4.5% crossing the 100,000 download mark, and only a select few, 1.1% and 2.1%, achieving over 500,000 and 1,000,000 downloads, respectively.
This data offers insights into the varied landscape of app popularity and competition on Google Play in 2023, which can be valuable for developers and analysts tracking app trends and performance on the platform.
Google Play app distribution by number of downloads 2023:
| Downloads | Percentage of apps |
|---|---|
| Under 100 | 25.63% |
| Above 100 | 28.22% |
| Above 1,000 | 24.25% |
| Above 10,000 | 13.95% |
| Above 100,000 | 4.52% |
| Above 500,000 | 1.17% |
| Above 1,000,000 | 2.13% |
Source: AppBrain
Number of apps on Google Play Store
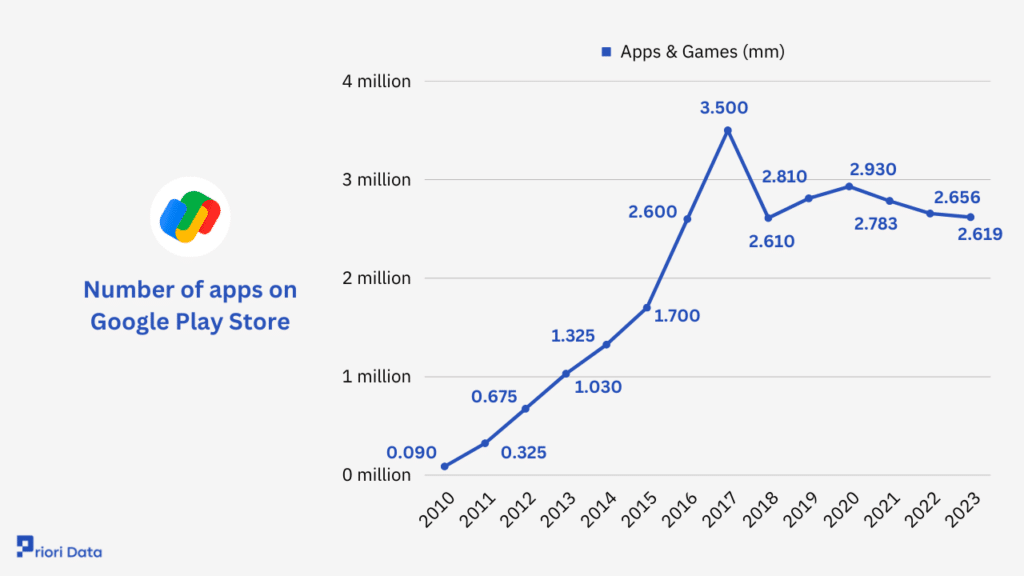
In 2010, the Google Play Store began with a mere 0.090 million apps & games, but this number quickly escalated.
By 2011, it had reached 0.325 million, and the following year saw further expansion to 0.675 million in 2012.
This growth trajectory continued, with 2013 crossing the 1 million mark at 1.030 million. The upward trend persisted, the peak was in 2017 when it reached 3.500 million.
While there was a slight dip in 2018 with 2.610 million, the store remained robust with around 2.8 million offerings in the subsequent years.
As of 2023, the platform maintains a substantial catalog with 2.619 million apps & games.
The slight dip was due to the strict policy changes made by the Play Store due to which several low-quality apps were removed to enhance the user experience.
Annual apps & games 2023:
| Year | Apps & Games (mm) |
|---|---|
| 2010 | 0.090 million |
| 2011 | 0.325 million |
| 2012 | 0.675 million |
| 2013 | 1.030 million |
| 2014 | 1.325 million |
| 2015 | 1.700 million |
| 2016 | 2.600 million |
| 2017 | 3.500 million |
| 2018 | 2.610 million |
| 2019 | 2.810 million |
| 2020 | 2.930 million |
| 2021 | 2.783 million |
| 2022 | 2.656 million |
| 2023 | 2.619 million |
Source: App Data Report, AppBrain
Number of publishers on Play Store
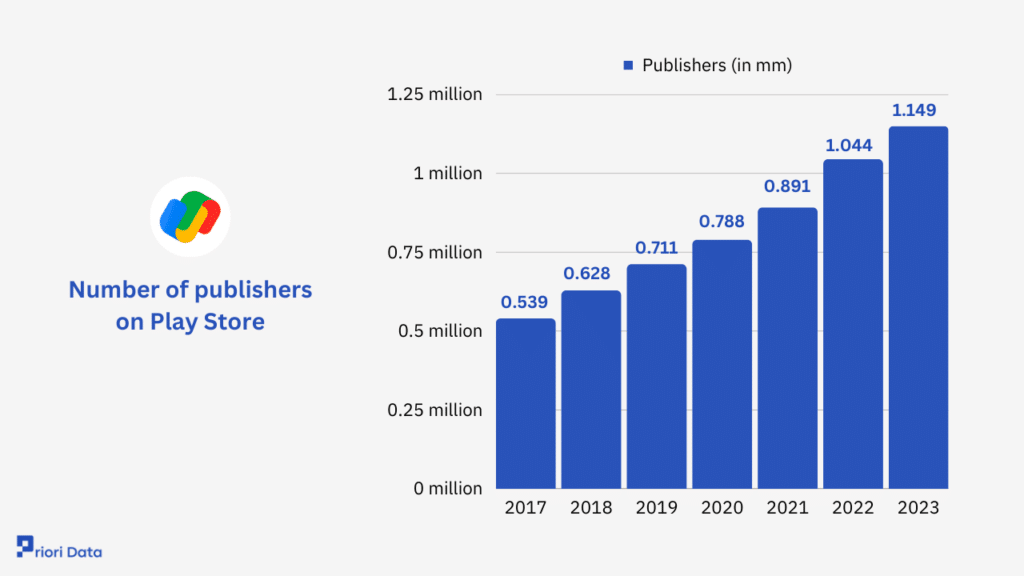
In 2017, there were approximately 0.539 million publishers, and this figure continued to rise year after year.
By 2018, it had increased to 0.628 million, demonstrating a steady growth trend. The following years saw even more substantial growth, with 0.711 million publishers in 2019 and 0.891 million in 2021.
The most significant leap occurred in 2022 when the number of publishers surged to 1.044 million.
As we look ahead to 2023, the trend continues, with an estimated 1.149 million publishers expected on the Google Play Store.
Number of publishers on Play Store 2017 to 2023:
| Year | Publishers (in mm) |
|---|---|
| 2017 | 0.539 million |
| 2018 | 0.628 million |
| 2019 | 0.711 million |
| 2020 | 0.788 million |
| 2021 | 0.891 million |
| 2022 | 1.044 million |
| 2023 | 1.149 million |
Source: 42matters
Most Downloaded Apps on Google Play Store
In the year 2023, a clear picture emerges for the most downloaded apps on the Google Play Store.
At the top of the list is TikTok, with a staggering 460 million downloads, closely followed by Instagram with 445 million downloads.
WhatsApp takes the third spot with 297 million downloads, showcasing its enduring popularity.
Further down the ranking, Subway Surfers secures the eighth position with 198 million downloads, while Messenger and Stumble Guys round off the list with 167 million and 158 million downloads, respectively.
Most Downloaded Apps on Google Play Store 2023:
| App | Downloads (mm) |
|---|---|
| TikTok | 460 |
| 445 | |
| 297 | |
| Snapchat | 255 |
| CapCut | 244 |
| Telegram | 244 |
| 223 | |
| Subway Surfers | 198 |
| Messenger | 167 |
| Stumble Guys | 158 |
Sources: AppMagic
Top Grossing Apps on Play Store
Topping the charts was Google One, which recorded $891 million in revenue, showing its widespread adoption and utility.
Following closely behind was TikTok, generating $674 million in revenue, a reflection of its continued popularity and engagement among users.
Coin Master and Candy Crush Saga secured their positions as consistent revenue generators, with $521 million and $502 million respectively.
Notably, Lineage M, Disney+, and Genshin Impact contributed substantially with around $350 million in revenue.
Roblox and Pokemon Go also maintained their strong presence, each recording $336 million and $321 million in revenue.
Finally, HBO Max rounded off the top ten list with $240 million in revenue, underscoring the growing demand for streaming services.
Google Play Store Top Grossing Apps:
| App | Revenue ($mm) |
|---|---|
| Google One | $891 million |
| TikTok | $674 million |
| Coin Master | $521 million |
| Candy Crush Saga | $502 million |
| Lineage M | $370 million |
| Disney+ | $358 million |
| Genshin Impact | $337 million |
| Roblox | $336 million |
| Pokemon Go | $321 million |
| HBO Max | $240 million |
Source: AppMagic
Google Play App Ratings
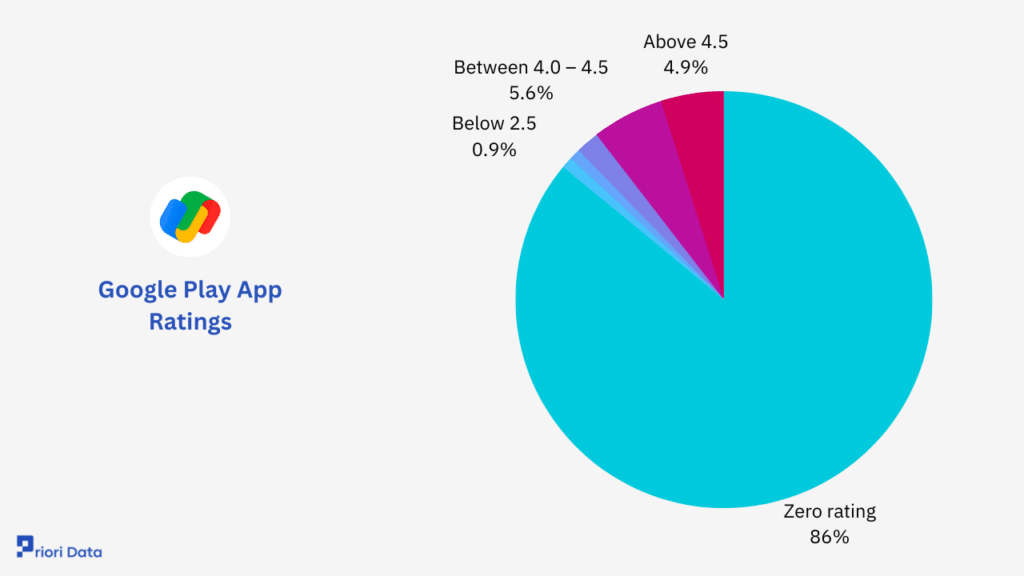
The statistics on Google Play app ratings provide valuable insights into the distribution of user ratings for the apps available on the platform.
It’s clear that the majority of apps fare well, with approximately 234,466 apps falling into the category of 4.0 stars or higher.
Among these, a substantial 124,993 apps boast ratings between 4.0 and 4.5, indicating a high level of user satisfaction.
Moreover, there are 109,473 apps that have earned ratings above 4.5, underlining a significant number of top-performing applications.
However, it’s worth noting that not all apps enjoy such positive ratings. A substantial 1,925,412 apps have received zero ratings, which could be an area of concern for developers.
Apps with ratings between 3.0 and 3.5 and between 3.5 and 4.0 constitute 40,457 and 69,806 apps, respectively, signifying a moderate level of satisfaction.
The below data clearly states that developers should pay close attention to user feedback and work towards enhancing the quality of their apps to improve user satisfaction and overall ratings.
Google Play App Ratings:
| Ratings | Total Number of Apps |
|---|---|
| Zero rating | 1,925,412 |
| Below 2.5 | 19,352 |
| Between 2.5 – 3.0 | 19,576 |
| Between 3.0 – 3.5 | 40,457 |
| Between 3.5 – 4.0 | 69.806 |
| Between 4.0 – 4.5 | 124,993 |
| Above 4.5 | 109,473 |
Source: Appbrain
New Android Apps Added Per Month
Google has been implementing stricter policies regarding app listings on their store. One noteworthy change includes the introduction of a flag for apps targeted towards children.
Google issued warnings, notifying developers to fill out this information. Developers who have lost interest in maintaining their apps might choose not to update this information, and as a consequence, Google may choose to remove their apps from the store.
New Android Apps Added Per Month:
| Date | Regular Apps | Low-Quality Apps |
|---|---|---|
| September ’22 | (564) | 2779 |
| October ’22 | 262 | 7254 |
| November ’22 | (8107) | (8821) |
| December ’22 | (7089) | (5237) |
| January ’23 | (10479) | (5413) |
| February ’23 | (9227) | (3522) |
| March ’23 | (10891) | (7083) |
| April ’23 | (12268) | (7295) |
| May ’23 | (11693) | (3182) |
| June ’23 | 6306 | 6465 |
| July ’23 | (10124) | (7228) |
| August ’23 | 671 | 8684 |
| September ’23 | 6003 | 8079 |
Google Play Apps Cost below $10
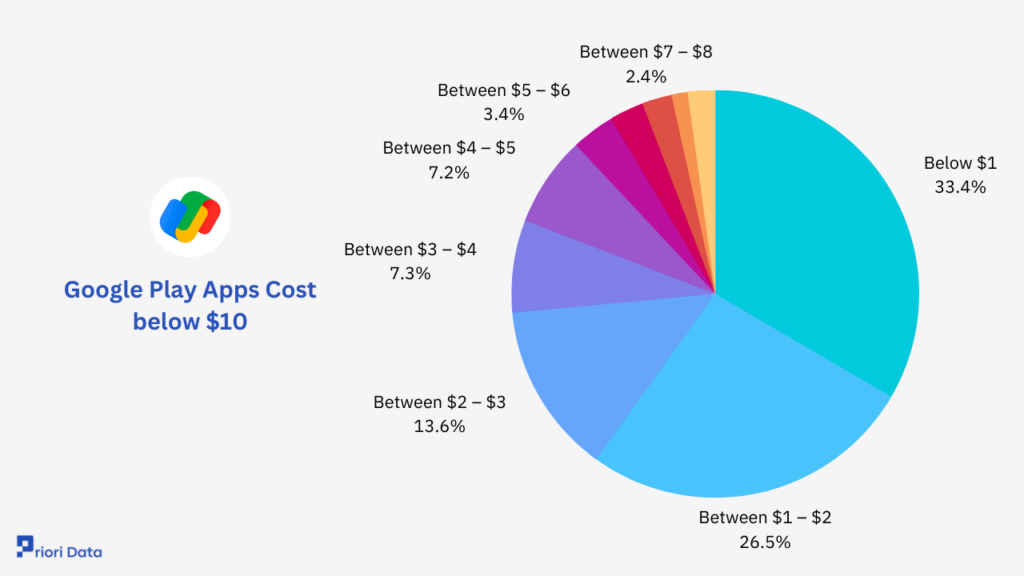
The majority of apps are priced below $1, with a substantial 33,254 apps falling into this category.
Moving up the price range, between $1 and $2, there are 26,392 apps available, while between $4 and $5, there are 7,135.
The number of apps further declines as we move towards the $10 threshold, with 2,174 apps priced between $9 and $10.
Google Play Apps Cost below $10:
| Price Range | Number Of Apps |
|---|---|
| Below $1 | 33,254 |
| Between $1 – $2 | 26,392 |
| Between $2 – $3 | 13,530 |
| Between $3 – $4 | 7,311 |
| Between $4 – $5 | 7,135 |
| Between $5 – $6 | 3,413 |
| Between $6 – $7 | 2,703 |
| Between $7 – $8 | 2,360 |
| Between $8 – $9 | 1,265 |
| Between $9 – $10 | 2,174 |
Source: Statista
Frequently Asked Questions (FAQ)
Q1. What is the distribution of free and paid Android apps on Play Store?
Ans: As of July 2023, 97% of all Android apps are available for free, whereas 3% are paid apps. (Statista)
Q2. What is the current number of paid Android apps on the Play Store?
Ans: There are around 86,149 paid Android apps in the market
Q3. What is the current number of free Android apps on the Play Store?
Ans: There are around 2,222,920 free Android apps in the market
Q4. How many Android apps are in the Google Play Store?
Ans: There are around 2,309,069 apps on the Play Store as of September 2023.
Q5. How many publishers are there on the Google Play Store?
Ans: There are around 1,161,164 publishers on the Play Store as of September 2023
Q6. What is the distribution of Games vs. apps on the Play Store?
Ans: There are around 531,995 gaming apps on Play Store whereas 3,243,426 apps are non-gaming apps
Q7. How many apps per day are released on the Play Store?
Ans: On Average, around 2,166 apps are released on Google Play every day.
Q8. How many apps per month are released on the Play Store?
Ans: On Average, around 84,333 apps are released on Google Play per month.
Q9. How many apps per week are released on the Play Store?
Ans: On Average, around 9,798 apps are released on Google Play per week.
Source: 42matters