


Started in 1976, Apple has emerged as one of the world’s most influential and recognizable brands. The company increased the rise of smartphones with the iPhone.
By 2021, Apple was valued at over $2 trillion, marking itself the most valuable tech company. As of the year 2022, the company generated $394.33 billion.
Keep reading about Apple’s past and present sales figures to better understand its business.

Apple Key Statistics
- Apple Service is the company’s second-largest division, making 18% of revenue.
- An estimated 1 billion iPhones, 72 million iPads, and 30 million Mac and MacBook units were sold in 2022.
- In 2021, Apple’s home and wearable division grew by 25%.
- Apple Music has 88 million subscribers as of 2022.
Apple Overview
- Date Founded: 1 April 1976
- Headquarters: Cupertino, California
- People: Tim Cook, Jeff Williams, Craig Federighi, and Eddy Cue
- Business Type: Public
- Industry: Consumer Electronics
Apple Revenue
In the past few years, Apple’s revenue has drastically increased from $108 billion to $394.33 billion.
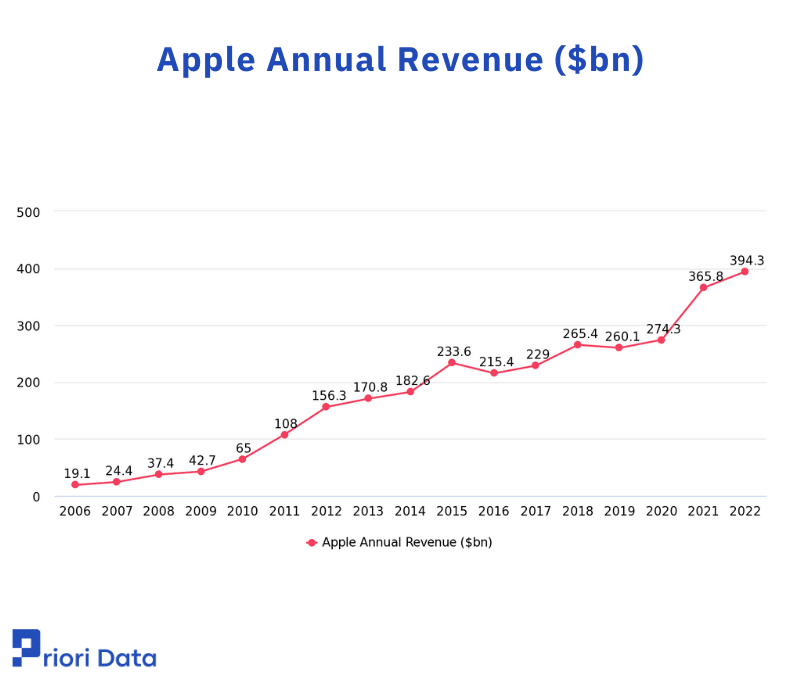
Apple Annual Revenue ($bn)
| Year | Revenue ($bn) |
| 2006 | 19.1 |
| 2007 | 24.4 |
| 2008 | 37.4 |
| 2009 | 42.7 |
| 2010 | 65 |
| 2011 | 108 |
| 2012 | 156.3 |
| 2013 | 170.8 |
| 2014 | 182.6 |
| 2015 | 233.6 |
| 2016 | 215.4 |
| 2017 | 229 |
| 2018 | 265.4 |
| 2019 | 260.1 |
| 2020 | 274.3 |
| 2021 | 365.8 |
| 2022 | 394.3 |
Apple Revenue by Region
In the USA, Apple has remained one of the most successful companies.
Around 45% of the total revenue of this company comes from America, approximately 40% from the USA alone.
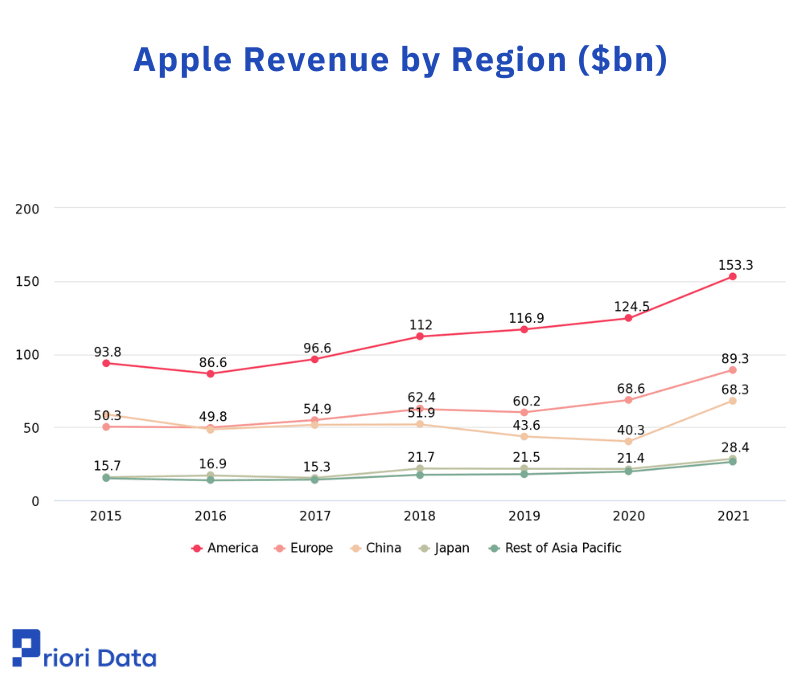
Apple Revenue by Region ($bn)
| Year | America | Europe | China | Japan | Rest of Asia Pacific |
| 2015 | 93.8 | 50.3 | 58.7 | 15.7 | 15 |
| 2016 | 86.6 | 49.8 | 48.5 | 16.9 | 13.6 |
| 2017 | 96.6 | 54.9 | 51.6 | 15.3 | 14.1 |
| 2018 | 112 | 62.4 | 51.9 | 21.7 | 17.4 |
| 2019 | 116.9 | 60.2 | 43.6 | 21.5 | 17.8 |
| 2020 | 124.5 | 68.6 | 40.3 | 21.4 | 19.6 |
| 2021 | 153.3 | 89.3 | 68.3 | 28.4 | 26.3 |
Apple Revenue by Product
iPhone has been the main revenue generator. Still, its sales have decreased over the past few years. Fortunately, Apple services saw a massive rise in the last five years.
iPhone Statistics and Revenue
Ever since its launch in 2008, iPhone has been Apple’s most valuable product. In fact, it was the main source of revenue.
But later, Apple diversified itself into other product lines, including AirPods, services, and watches. Still, the iPhone generates 50% of the total revenue.
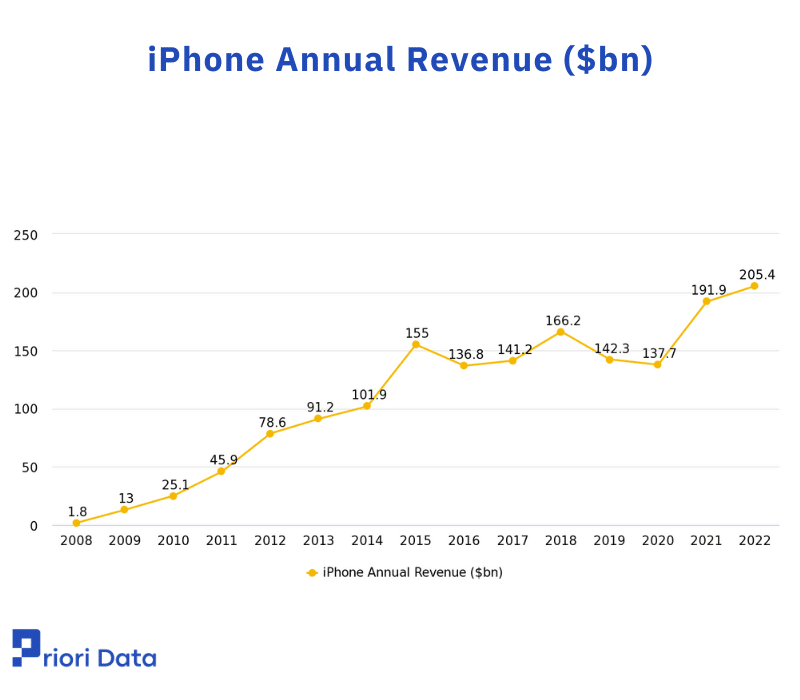
From the year 2008 to 2015, iPhone saw massive growth in its sales. But the revenue of this product stagnated for five years. Hopefully, iPhone’s popularity will increase revenue by 39% in 2021.
As of 2022, the iPhone is one of the top choices of people, with 205.4 billion in revenue.
iPhone Annual Revenue ($bn)
| Year | Revenue ($bn) |
| 2008 | 1.8 |
| 2009 | 13 |
| 2010 | 25.1 |
| 2011 | 45.9 |
| 2012 | 78.6 |
| 2013 | 91.2 |
| 2014 | 101.9 |
| 2015 | 155 |
| 2016 | 136.8 |
| 2017 | 141.2 |
| 2018 | 166.2 |
| 2019 | 142.3 |
| 2020 | 137.7 |
| 2021 | 191.9 |
| 2022 | 205.4 |
iPhone Sales by Region
iPhone sales saw a major growth from 2008 to 2015, with a steady decline till 2020. A major decline occurred in China, but in 2021, iPhone sales increased, marking itself as the most popular mobile phone.
While iPhone sales have decreased for five years, the company has added more active iPhone years each year. But how did it happen? Well, Apple focused on offering services and better long-term revenue sources.
iPad Statistics and Revenue
After the iPhone became successful, Apple launched the iPad. This product added $19 billion to Apple’s total revenue in the first year of its launch.
In the fourth quarter of 2022, the company reportedly ships 22.5 million tablets worldwide.
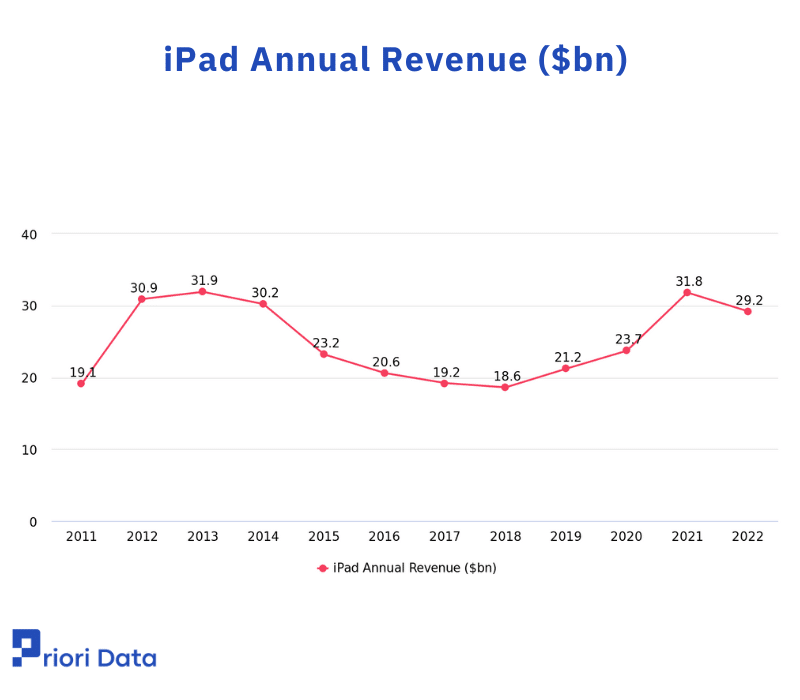
Ever since its launch, iPad has managed to be popular. Its revenue has stayed between $20 to $30 billion.
iPad Annual Revenue ($bn)
| Year | Revenue ($bn) |
| 2011 | 19.1 |
| 2012 | 30.9 |
| 2013 | 31.9 |
| 2014 | 30.2 |
| 2015 | 23.2 |
| 2016 | 20.6 |
| 2017 | 19.2 |
| 2018 | 18.6 |
| 2019 | 21.2 |
| 2020 | 23.7 |
| 2021 | 31.8 |
| 2022 | 29.2 |
iPad Sales
In 2020, iPad saw impressive growth of 57% in its sales. But the next year, the sales dropped. iPad generated around 7.15 billion in the fourth quarter of Apple’s fiscal year.
Wearable, Home, and Accessories Statics and Revenue
Determining the revenue of Apple’s other categories like wearable, home, and accessories is difficult. But Beats, Watch, and AirPods are key elements in this segment.
After combining all its hardware segments, Apple saw a 243% growth in this segment. Apple Watch roughly contributes $12 to $14 billion each year. Likewise, AirPods contribute $10 billion to the business.
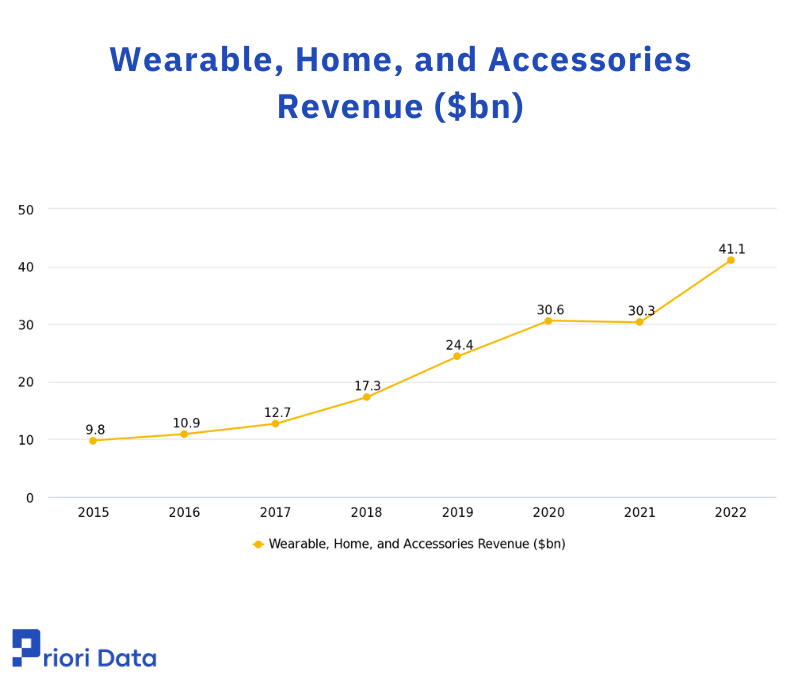
Wearable, Home, and Accessories Revenue ($bn)
| Year | Revenue ($bn) |
| 2015 | 9.8 |
| 2016 | 10.9 |
| 2017 | 12.7 |
| 2018 | 17.3 |
| 2019 | 24.4 |
| 2020 | 30.6 |
| 2021 | 30.3 |
| 2022 | 41.1 |
Mac Statistics and Revenue
While Apple shifted its focus to mobile, its Mac products remained one of its essential components. Although PC sales have not progressed, Apple has added more revenue and sales since 2009.
Over the years, Apple has focused on its core products, including MacBook Air, Mac Pro, iMac, and MacBook Pro.
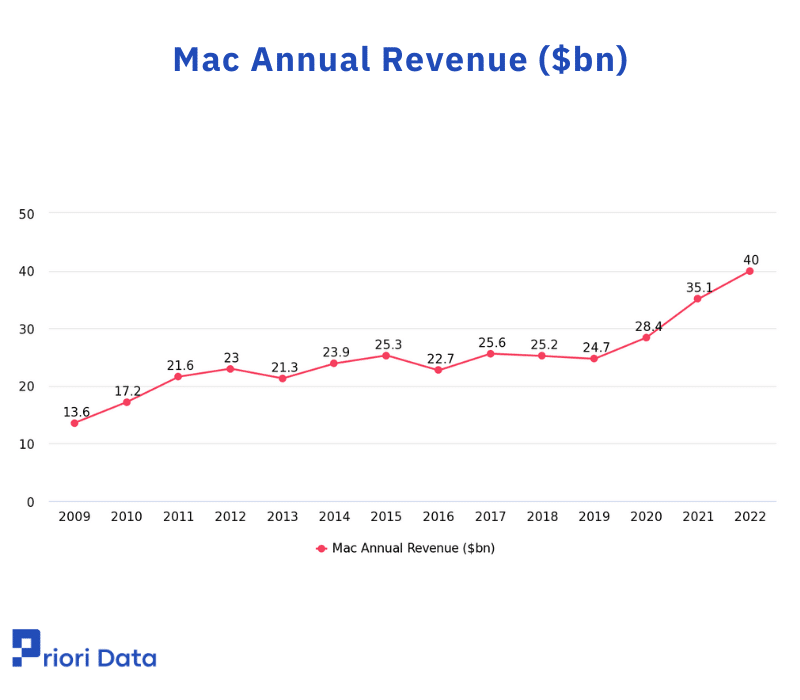
Mac Annual Revenue ($bn)
| Year | Revenue ($bn) |
| 2009 | 13.6 |
| 2010 | 17.2 |
| 2011 | 21.6 |
| 2012 | 23 |
| 2013 | 21.3 |
| 2014 | 23.9 |
| 2015 | 25.3 |
| 2016 | 22.7 |
| 2017 | 25.6 |
| 2018 | 25.2 |
| 2019 | 24.7 |
| 2020 | 28.4 |
| 2021 | 35.1 |
| 2022 | 40 |
Apple Services Statistics
Apple services have remained an essential part of the revenue. It has significantly increased over the years. As of 2022, Apple Services was reported to have a revenue of 78 billion.
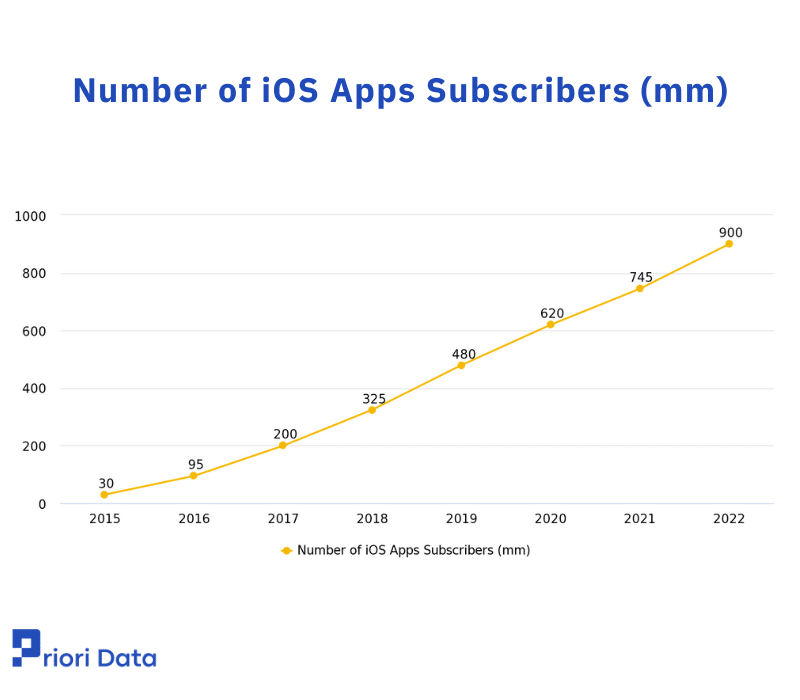
Additionally, the number of iOS subscribers has also increased. In 2022, around 900 iOS users were subscribed to one or more apps. It is a 20% increase from the previous year.
Number of iOS Apps Subscribers (mm)
| Year | Subscriptions (mm) |
| 2015 | 30 |
| 2016 | 95 |
| 2017 | 200 |
| 2018 | 325 |
| 2019 | 480 |
| 2020 | 620 |
| 2021 | 745 |
| 2022 | 900 |
Apple Music and Apple TV+ Subscribers
Apple Music has managed to be the second-largest music streaming service provider. First on the list is Spotify, with 150 million subscribers.
In the year 2019, Apple invested $6 billion into TV+. It was a gamble move, with Amazon, Netflix, and Disney occupying the market. As of 2022, Apple TV+ has an estimated 25 million subscribers.
Apple FAQ
Ques: What is Apple’s main source of revenue?
Ans: iPhones remain to be the main source of revenue for Apple.
Ques: What was Apple’s biggest success?
Ans: Apple’s biggest success was when iPhones revenue increased from $37.4 billion in 2008 to $65 billion in 2010