


Having originated as a modest DVD rental service in 1997, Netflix has evolved into a highly successful streaming giant with countless subscribers.
Remarkably ahead of its time, Netflix implemented an algorithm early on to determine user preferences, which has undoubtedly contributed to its widespread appeal as a subscription-based platform.
Even before Netflix started streaming services, it focused on recommendation algorithms to offer unique experiences. But the advanced technologies couldn’t stop Netflix from hitting rock bottom.
However, the platform continued offering the best streaming service, which increased its popularity more than ever. As of the fourth quarter of 2022, Netflix has had nearly 231 million paid subscribers.
Read on to learn about Netflix’s revenue, customers, and profits
Netflix Statistics 2023
Netflix has distributed many noteworthy films, including The Irishman, Marriage Story, Beasts of No Nation, and more. At the 2020 Oscars, Netflix received multiple nominations in many categories.
Netflix won its first award in 2012 for being the most illustrative because it changed how people watch television.
With Netflix’s growth in popularity and subscribers, its number of competitors also increased. With Amazon Prime and Disney starting to take over the market, Netflix saw a decline in its growth.
To combat this challenge, the platform launched a cheaper ad-supported tier.
Here’s a brief detail on Netflix’s key statistics:
- As of 2022, the platform has generated more than $31.6 billion in revenue.
- Netflix’s largest market is North America, which helps it generate $14 billion in revenue.
- The net income of Netflix in 2022 was $4.4 billion.
- Squid Game, released in September 2021 on Netflix, became the biggest TV show. The show was watched online by more than 142 million households.
Netflix Overview
- Launch Date: 29 August 1997 (established), 15 January 2017 (streaming service launch)
- Headquarters: Los Gatos, California
- People: Reed Hastings, Ted Sarandos, and Greg Peters
- Business Type: Public
- Industry: Video Streaming
Netflix Revenue
By the year 2022, Netflix is known to have generated $31.6 billion, a 6.7% increase from the previous year. But in Q4 2022, Netflix saw its first quarterly decline.
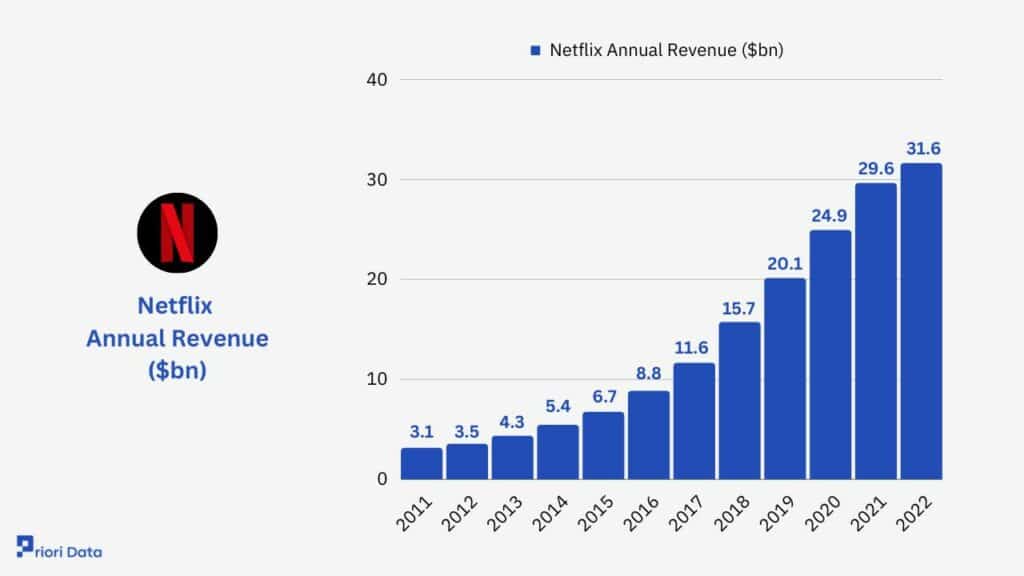
Netflix Annual Revenue ($bn)
| Year | Revenue ($bn) |
| 2011 | 3.1 |
| 2012 | 3.5 |
| 2013 | 4.3 |
| 2014 | 5.4 |
| 2015 | 6.7 |
| 2016 | 8.8 |
| 2017 | 11.6 |
| 2018 | 15.7 |
| 2019 | 20.1 |
| 2020 | 24.9 |
| 2021 | 29.6 |
| 2022 | 31.6 |
Netflix Revenue by Region
The US and Canadian market helps Netflix earn nearly 44% of revenue.
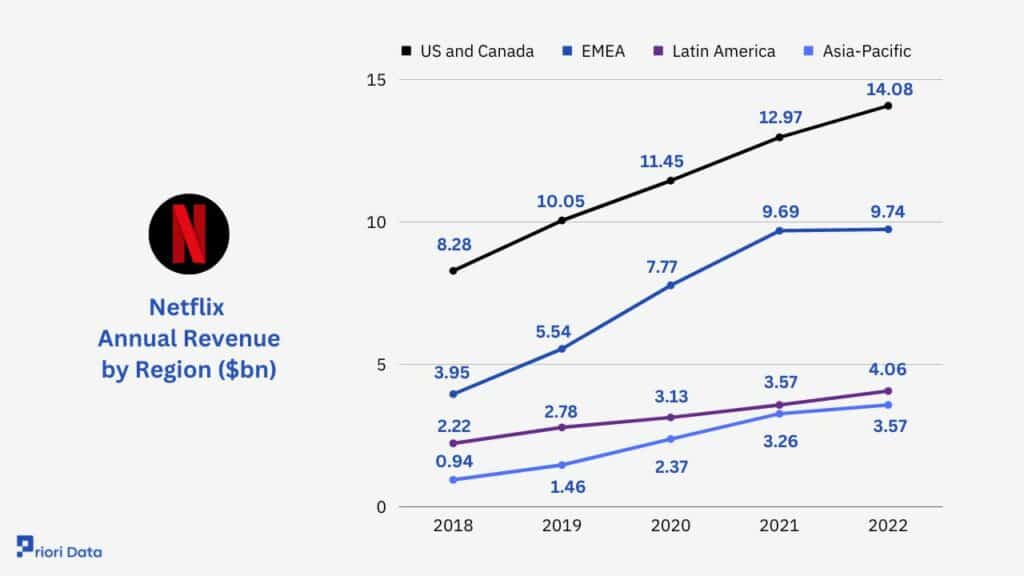
Netflix Annual Revenue by Region ($bn)
| Year | US and Canada | EMEA | Latin America | Asia-Pacific |
| 2018 | 8.28 | 3.95 | 2.22 | 0.94 |
| 2019 | 10.05 | 5.54 | 2.78 | 1.46 |
| 2020 | 11.45 | 7.77 | 3.13 | 2.37 |
| 2021 | 12.97 | 9.69 | 3.57 | 3.26 |
| 2022 | 14.08 | 9.74 | 4.06 | 3.57 |
Netflix Average Revenue Per Unit (ARPU) By Region
The majority of Netflix ARPU again comes from the US and Canadian markets at $15.86. In 2022, Latin America had an ARPU of $8.48.
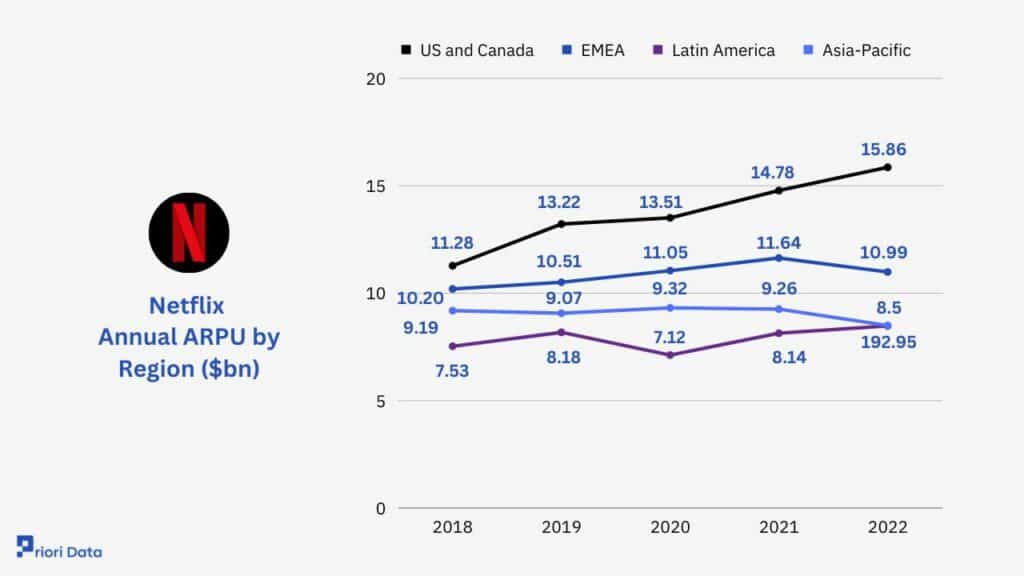
Netflix Annual ARPU by Region ($bn)
| Year | US and Canada | EMEA | Latin America | Asia-Pacific |
| 2018 | 11.28 | 10.20 | 7.53 | 9.19 |
| 2019 | 13.22 | 10.51 | 8.18 | 9.07 |
| 2020 | 13.51 | 11.05 | 7.12 | 9.32 |
| 2021 | 14.78 | 11.64 | 8.14 | 9.26 |
| 2022 | 15.86 | 10.99 | 8.48 | 8.5 |
Is Netflix Profitable?
As of 2022, Netflix has made a net profit of $4.4 billion. The year marked the company’s first decline since 2012.
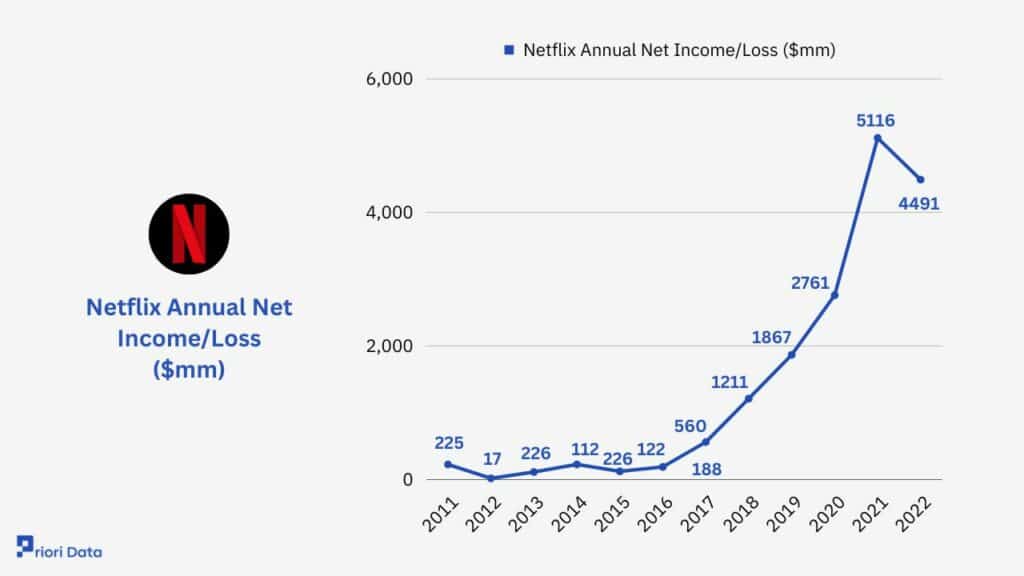
Netflix Annual Net Income/Loss ($mm)
| Year | Net Income/Loss ($mm) |
| 2011 | 225 |
| 2012 | 17 |
| 2013 | 112 |
| 2014 | 226 |
| 2015 | 122 |
| 2016 | 188 |
| 2017 | 560 |
| 2018 | 1211 |
| 2019 | 1867 |
| 2020 | 2761 |
| 2021 | 5116 |
| 2022 | 4491 |
What is Netflix Content Spread?
In 2022, Netflix saw a slight decrease in its content spread, from $17.7 billion to $16.8 billion.
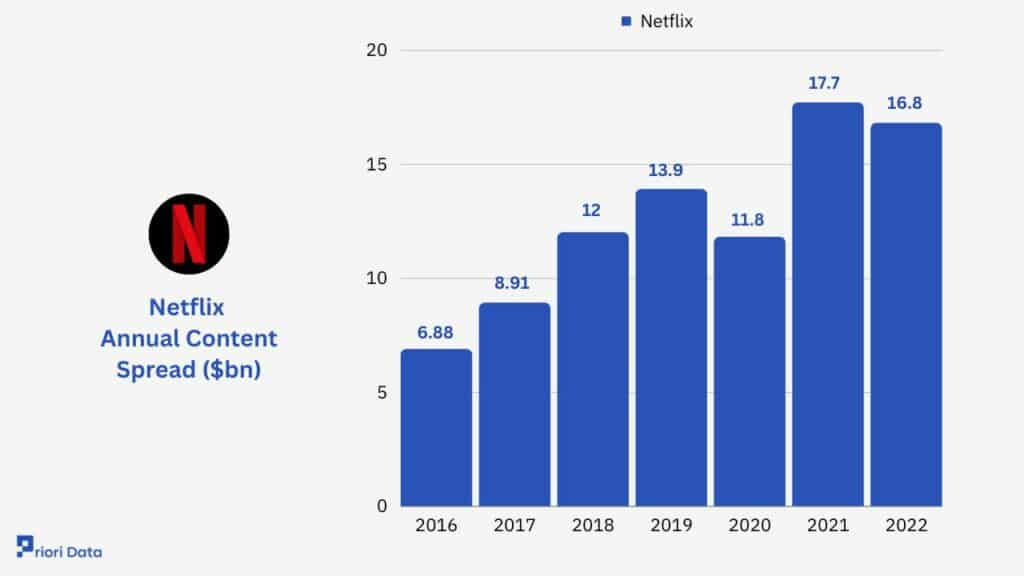
Netflix Annual Content Spread ($bn)
| Year | Content Spread ($bn) |
| 2016 | 6.88 |
| 2017 | 8.91 |
| 2018 | 12 |
| 2019 | 13.9 |
| 2020 | 11.8 |
| 2021 | 17.7 |
| 2022 | 16.8 |
How Many Subscribers does Netflix have?
Although Netflix reported its first decline in the number of subscribers in Q1 of 2022, it saw a rise in Q3 of 2022.
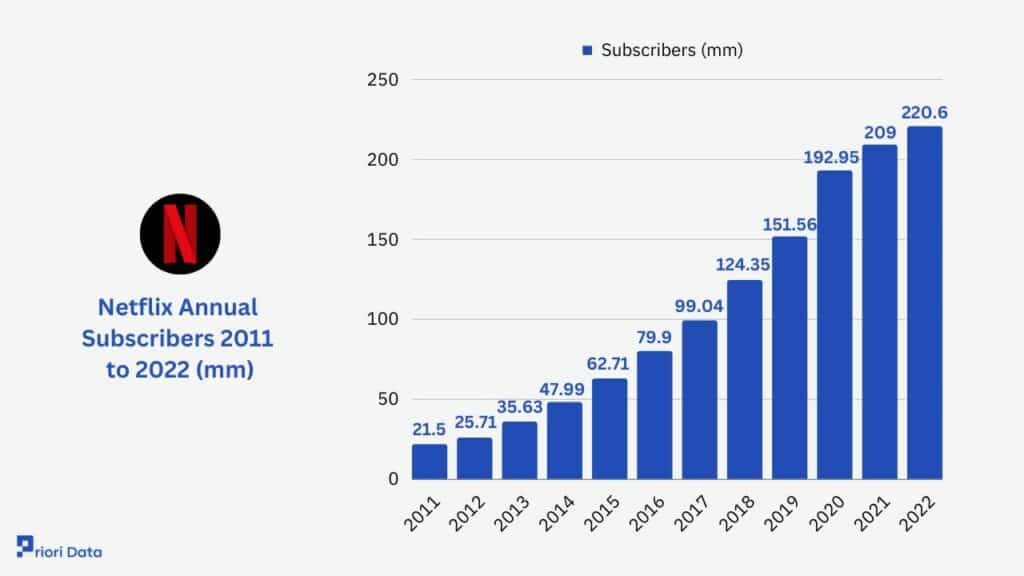
Netflix Annual Subscribers 2011 to 2022 (mm)
| Year | Subscribers (mm) |
| 2011 | 21.5 |
| 2012 | 25.71 |
| 2013 | 35.63 |
| 2014 | 47.99 |
| 2015 | 62.71 |
| 2016 | 79.9 |
| 2017 | 99.04 |
| 2018 | 124.35 |
| 2019 | 151.56 |
| 2020 | 192.95 |
| 2021 | 209 |
| 2022 | 220.6 |
Netflix is one of the most popular streaming service providers in the US, followed by YouTube and Hulu.
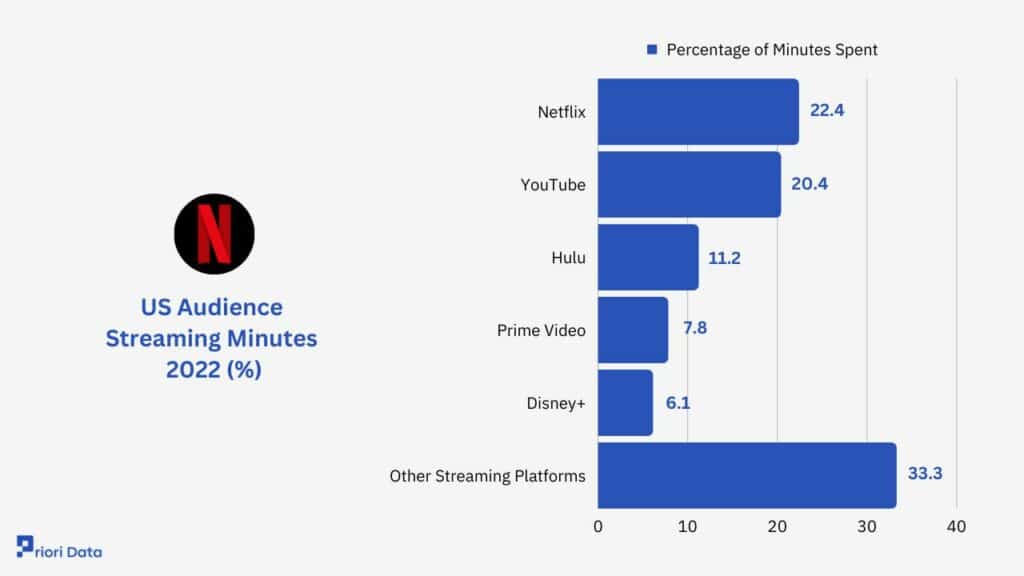
US Audience Streaming Minutes 2022 (%)
| App | Percentage of Minutes Spent |
| Netflix | 22.4 |
| YouTube | 20.4 |
| Hulu | 11.2 |
| Prime Video | 7.8 |
| Disney+ | 6.1 |
| Other Streaming Platforms | 33.3 |
Netflix Subscription Plan
Netflix is currently offering 4 subscription plans. It still offers DVDs in mailboxes but only in the US.
| Basic with Ads | Basic | Standard | Premium |
| $6.99/month | $9.99/month | $15.49/month | $19.99/month |
| Some titles are inaccessible | Unlimited TV shows, movies, and games | Unlimited TV shows, movies, and games | Unlimited TV shows, movies, and games |
| 1 stream at a time | 1 stream at a time | 2 streams at a time | 4 streams at a time |
| Ads | Ad-free | Ad-free | Ad-free |
| HD | HD | Full HD | Ultra HD |
It’s important to remember that Netflix’s plan varies from country to country, with Pakistan having the cheapest option.
Netflix US Library Size
Netflix US is far behind Amazon Prime Video in library size. But it offers more movies and TV shows than other streaming platforms.
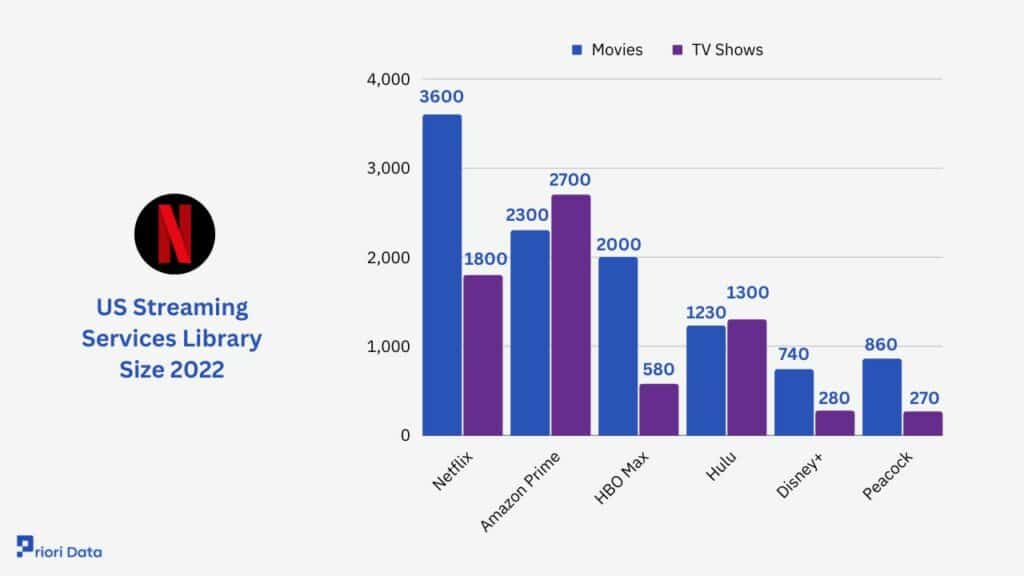
US Streaming Services Library Size 2022
| App | Movies | TV Shows |
| Netflix | 3600 | 1800 |
| Amazon Prime | 2300 | 2700 |
| HBO Max | 2000 | 580 |
| Hulu | 1230 | 1300 |
| Disney+ | 740 | 280 |
| Peacock | 860 | 270 |
Netflix FAQ
Ques 1. What TV show is most streamed on Netflix?
Ans: The Office is highly streamed Netflix content with a total of 57.1 billion minutes.
Ques 2. What is the age of average Netflix users?
Ans: The average age of Netflix users is between 35-44 years.
Ques 3. How many people are using Netflix without paying?
Ans: It’s estimated that 31% of people use Netflix without paying for the service.